|
Papers are classified according to difficulty (from  - easy, - easy,  - intermediate, to - intermediate, to  - advanced) and importance (indicated by the number of stars). - advanced) and importance (indicated by the number of stars).
Regularly confused definitions
- Prospective or retrospective?
see Figure 1 in Euser AM, Zoccali C, Jager KJ, Dekker FW. Cohort studies: prospective versus retrospective. Nephron Clin Pract. 2009;113(3):c214-7. doi:10.1159/000235241
- Multivariable or multivariate? Univariable or univariate?
Peters, T. J. (2008). Multifarious terminology: multivariable or multivariate? univariable or univariate? Paediatric and Perinatal Epidemiology, 22(6), 506-506. doi:10.1111/j.1365-3016.2008.00966.x
Educational publications on statistical methods in medical research
Multivariable modeling
- Heinze G, Dunkler D. Five myths about variable selection. Transplant International 2017; 30: 6-10.
Keywords: association, best practice, correct interpretation, explanatory models, guidelines, p-value, variable selection
Difficulty & importance:
Summary: Multivariable regression models are often used in medical research to identify or to confirm baseline variables which have an independent association, causally or only evidenced by statistical correlation, with an outcome of interest. Although sound theory is lacking, variable selection is a popular statistical method which seemingly reduces the complexity of such models. However, in fact, variable selection often complicates analysis as it invalidates common tools of statistical inference such as P-values and confidence intervals. Furthermore, variable selection requires computer-intensive stability investigations and a particularly cautious interpretation of results. Five common misconceptions, which often lead to inapprpriate application of variable selection, are discussed:
Myth 1: “The number of variables in a model should be reduced until there are 10 events per variables.” No!
Myth 2: “Only variables with proven univariable-model significance should be included in a model.” No!
Myth 3: “Insignificant effects should be eliminated from a model.” No!
Myth 4: “The reported P-value quantifies the type I error of a variable being falsely selected.” No!
Myth 5: “Variable selection simplifies analysis.” No!
- Heinze G, Wallisch C and Dunkler D. Variable selection – A review and recommendations for the practicing statistician. Biometrical Journal. 2018:1-19.
Keywords: association, best practice, correct interpretation, explanatory models, guidelines, model stability, p-value, variable selection
Difficulty & importance:
Summary: Statistical models are useful tools applied in many research fields dealing with empirical data. They connect an outcome variable to one or several so-called independent variables and quantify the strength of association between independent variables and outcome variable. Theory of statistical models is well-established if the
set of independent variables to consider is fixed and small. Hence, we can assume that
effect estimates are unbiased and the usual methods for confidence interval estimation
are valid. In routine work, however, it is not known a priori which covariates should
be included in a model, and often we are confronted with the number of candidate
variables in the range 10–30. This number is often too large to be considered in a statistical
model. This long educational paper provides an overview of various available variable selection methods
that are based on significance or information criteria, penalized likelihood, the
change-in-estimate criterion, background knowledge, or combinations thereof. These
methods were usually developed in the context of a linear regression model and then
transferred to more generalized linear models or models for censored survival data.
Variable selection, in particular if used in explanatory modeling where effect estimates
are of central interest, can compromise stability of a final model, unbiasedness
of regression coefficients, and validity of p-values or confidence intervals. Therefore, pragmatic recommendations for the practicing statistician on application of
variable selection methods in general (low-dimensional) modeling problems and on
performing stability investigations and inference are given.
p-values: how they should be used
- Wasserstein RL, Lazar NA. The ASA's statement on p-values: context, process, and purpose. The American Statistician 2016. doi:10.1080/00031305.2016.1154108
Keywords: best practice, correct interpretation, guidelines, p-value
Difficulty & importance:
Summary: Many scientific conclusions are based on the concept of 'statistical significance', typically assessed with an index called the p-value. The p-value can be a useful statistical
measure, but it is commonly misused and misinterpreted. In this statement of the ASA, the American Statistical Association, some very common misconceptions about the p-value are demystified and the following six statements about the correct usage of the p-value are discussed in simple terms:
1. P-values can indicate how incompatible the data are with a specified statistical model.
2. P-values do not measure the probability that the studied hypothesis is true, or the
probability that the data were produced by random chance alone.
3. Scientific conclusions and business or policy decisions should not be based only on
whether a p-value passes a specific threshold.
4. Proper inference requires full reporting and transparency.
5. A p-value, or statistical significance, does not measure the size of an effect or the
importance of a result.
6. By itself, a p-value does not provide a good measure of evidence regarding a model or
hypothesis.
Analysis of repeated measurements
- Leffondre K, Boucquemont J, Tripepi G, Stel VS, Heinze G, Dunkler D. Analysis of risk factors associated with renal function trajectory over time: a comparison of different statistical approaches. Nephrology Dialysis Transplantation 2014. Published online before print.
Keywords: analysis, chronic kidney disease, dropout, generalized estimating equations, glomerular filtration rate, linear mixed model
Difficulty & importance:
Summary: The most commonly used methods to investigate risk factors associated with renal function trajectory over time include linear regression on individual glomerular filtration rate slopes, linear mixed models and generalized estimating equations (GEEs). In this manuscript the principles of these three methods are explained and their advantages and limitations in particular when renal function trajectories are not completely observable due to dropout are discussed. Using data from a hypothetical cohort of 200 patients with chronic kidney disease at inclusion and seven subsequent annual measurements of GFR, we illustrate that the linear mixed model is the preferred method to investigate risk factors associated with renal function trajectories in studies, where patients may dropout during the study period because of initiation of renal replacement therapy.
The interpretation of estimates from linear regression on individual slopes, generalized estimating equations and linear mixed models are explained in detail in the appendix (should be read in the PDF version of the mansucript). The online supplement includes commented R code and instructions for analyses in SPSS.
Analysis of time-to-event data
-
Stel, V. S., Heinze, G., Tripepi, G., Zoccali, C., & Jager, K. J. (2015). Seven essential tools of a cardiologist's survival kit. International Journal of Cardiology, 191(0), 87-89.
Keywords: analysis, Cox proportional hazards regression, Kaplan-Meier analysis, survival
Difficulty & importance:
Summary: In this short and very easy to read paper, the authors describe the seven main steps of an analysis with time-to-event data—from the preparation of the data set, descriptive analysis to effect size estimation. Correct reporting of relevant statistcal measures is discussed, as well. All steps can be performed with standard statistical software, like SPSS, SAS or R.
- Gleiss A, Oberbauer R and Heinze G. An unjustified benefit: immortal time bias in the analysis of time-dependent events. Transplant International 2018;31:125-130.
Keywords:
analysis, bias, immortal time bias, landmark analysis, survival, time-dependent events
Difficulty & importance:
Summary: Immortal time bias is a problem arising from methodologically wrong
analyses of time-dependent events in survival analyses. This educational paper describes landmark analysis as a method of choice to avoid immortal time
bias. Landmark analysis
can be easily implemented with common statistical software. The paper gives further typical examples of immortal time bias (in the context of transplant research), discusses strengths and limitations of landmark analysis and also shortly presents other methods
to address immortal time bias.
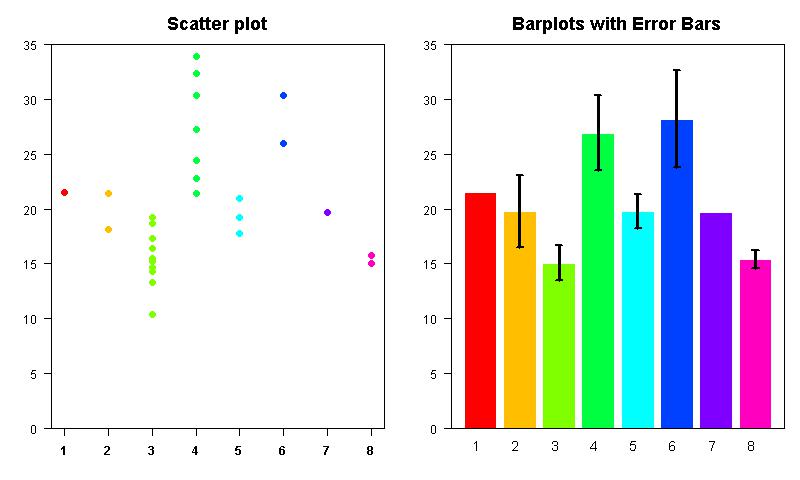
Bar-plots with error bars (aka 'mean error plots')
Further online resources
Educational publications on medical research
How to get started
- Broman, K. W., Woo, K.H. (2017) Data organization in spreadsheets. The American Statistician
Keywords: best practice, data management, data organisation, spreadsheets, medical research
Difficulty & importance:
Summary: Spreadsheets, typically using Microsoft Excel, is typically used for data entry and data storage. The paper gives some practical recommendations how to organise spreadsheets to reduce errors and ease later analyses. The basic principles are: be consistent, write dates like YYYY-MM-DD, don't leave any cells empty, put just one thing in a cell, organize the data as a single rectangle (with subjects as rows and variables as columns, and with a single header row), create a data dictionary, don't include calculations in the raw data files, don't use font color or highlighting as data, choose good names for things, make backups, use data validation to avoid data entry errors, and save the data in plain text file. Following these recommendations will make statistical analyses much easier, will save time and will reduce possible errors.
- Bond, C. M. (2014). The research jigsaw: how to get started. Can J Hosp Pharm, 67(1), 28-30
Keywords: best practice, medical research
Difficulty & importance:
Summary: This short article explains the whole research process, including what research is and how to do it. This article is the first in the CJHP Research Primer Series. It is intended to appeal to relatively inexperienced researchers. The articles are written for practising pharmacists, but these general principles are of relevance for everyone conducting medical research.
This collection of educational publications on statistical methods often used in medical reaseach will be continously updated. |