
J. Wilflingseder(1,2), A. Kainz(1,2), I. Mühlberger(3), P. Perco(3), R. Langer(4), I. Kristo(5), B. Mayer(3), R. Oberbauer(1,2)
1- Department of Nephrology, KH Elisabethinen, Linz, Austria
2- Department of Nephrology, Medical University Vienna, Austria
3- emergentec biodevelopment GmbH, Vienna
4- Department of Transplantation and Surgery, Semmelweis University, Budapest, Hungary
5- Department of Transplant Surgery Medical University of Vienna, Vienna

Demographic data of transplant donors and recipients stratified by treatment assignment. Continuous data are provided as median (1st, 3rd quartile), categorical data are shown as counts.
View PDF
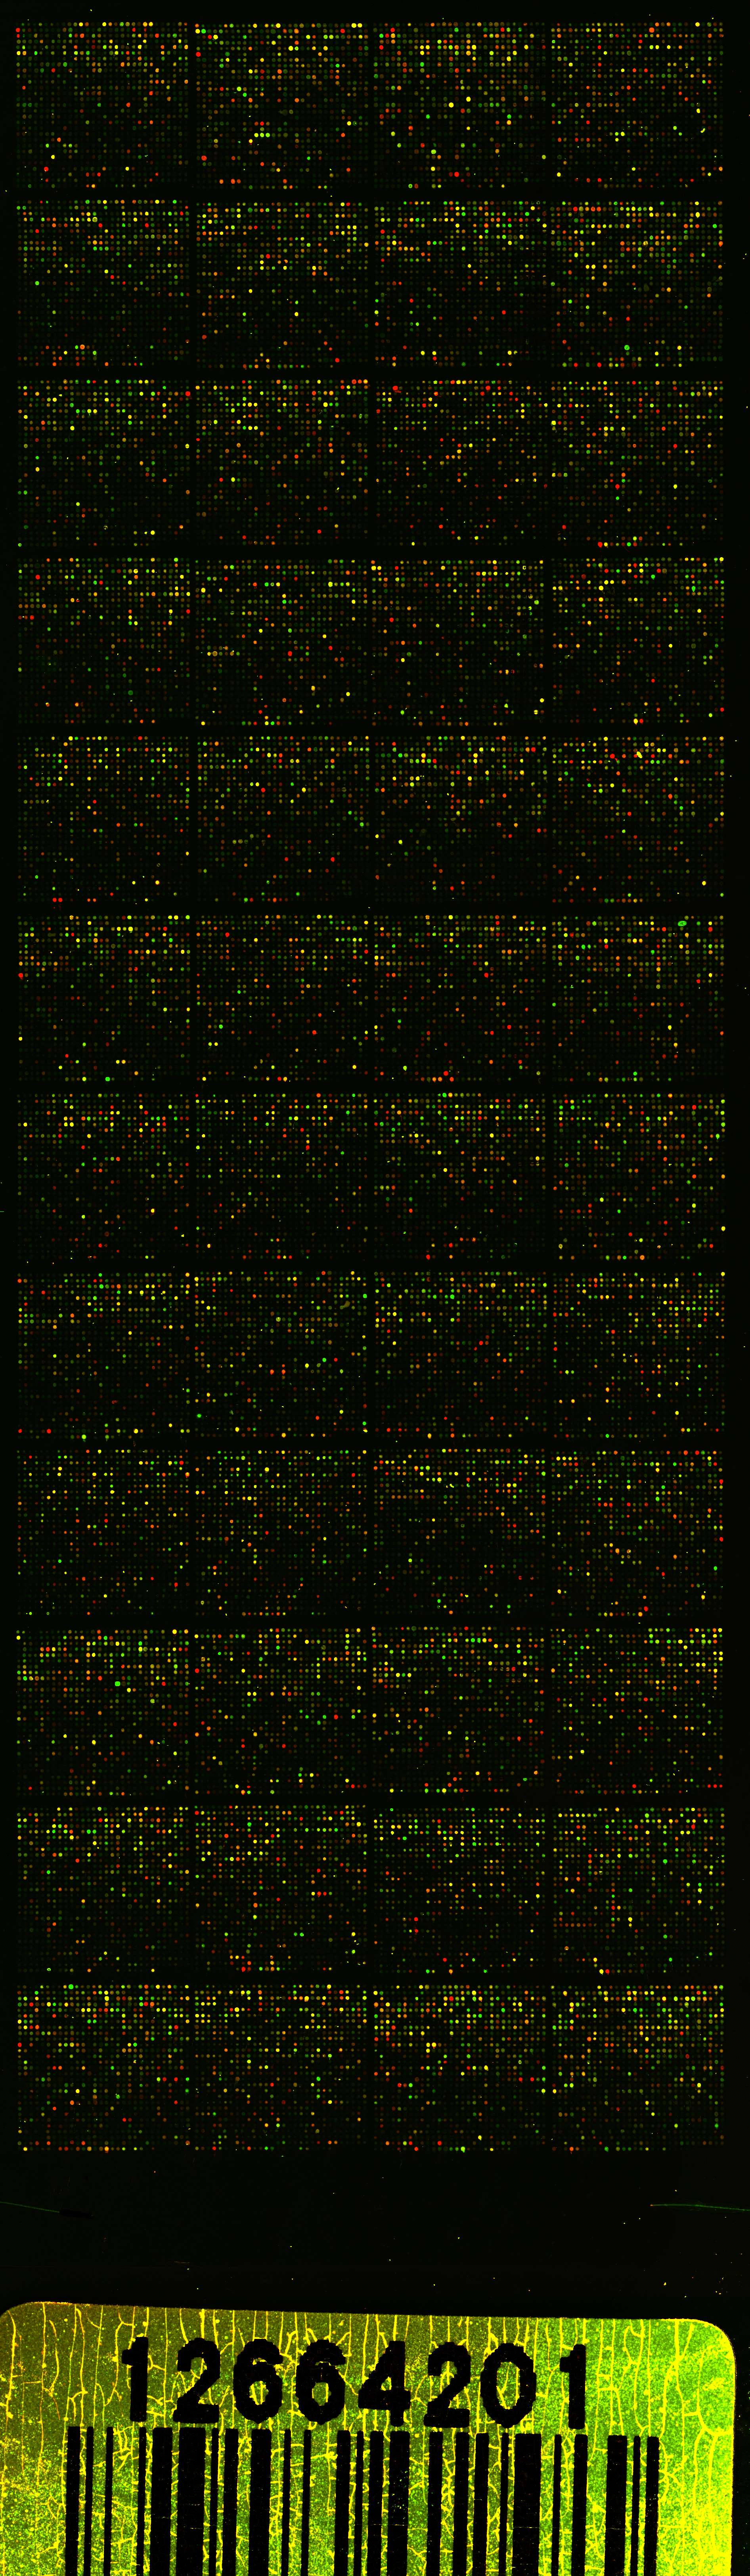
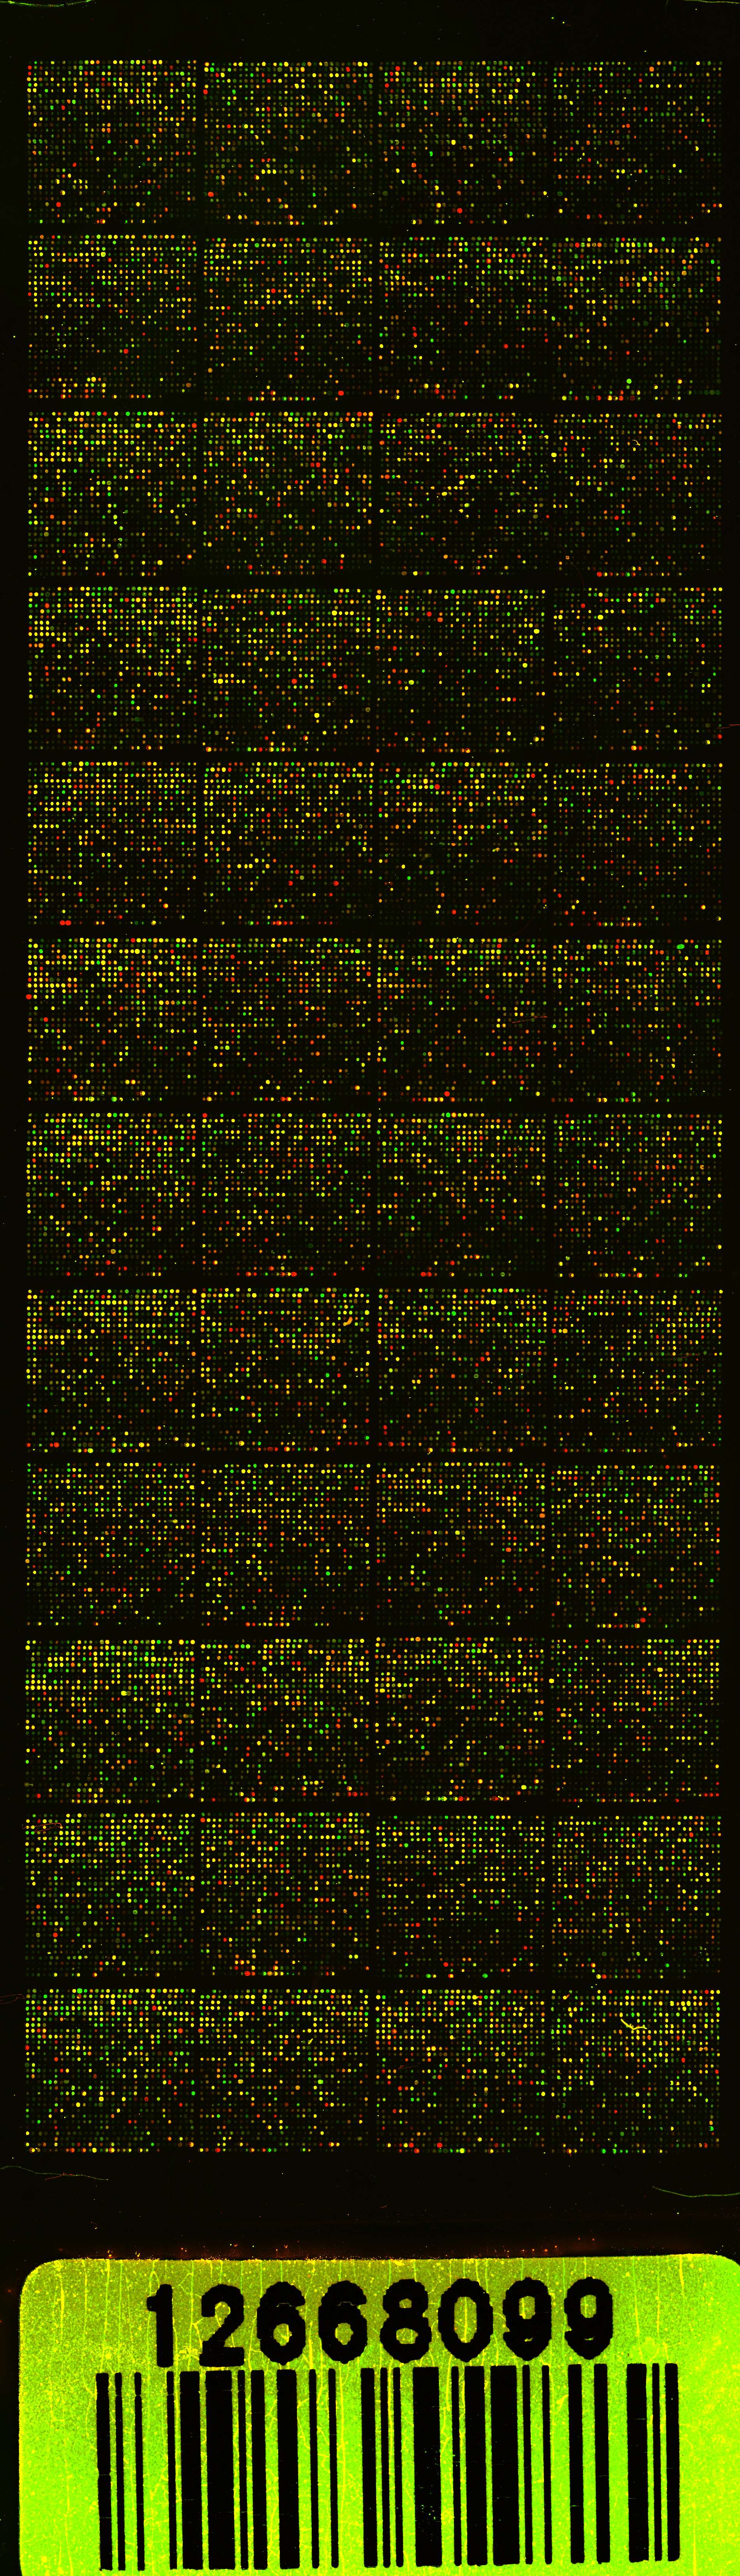
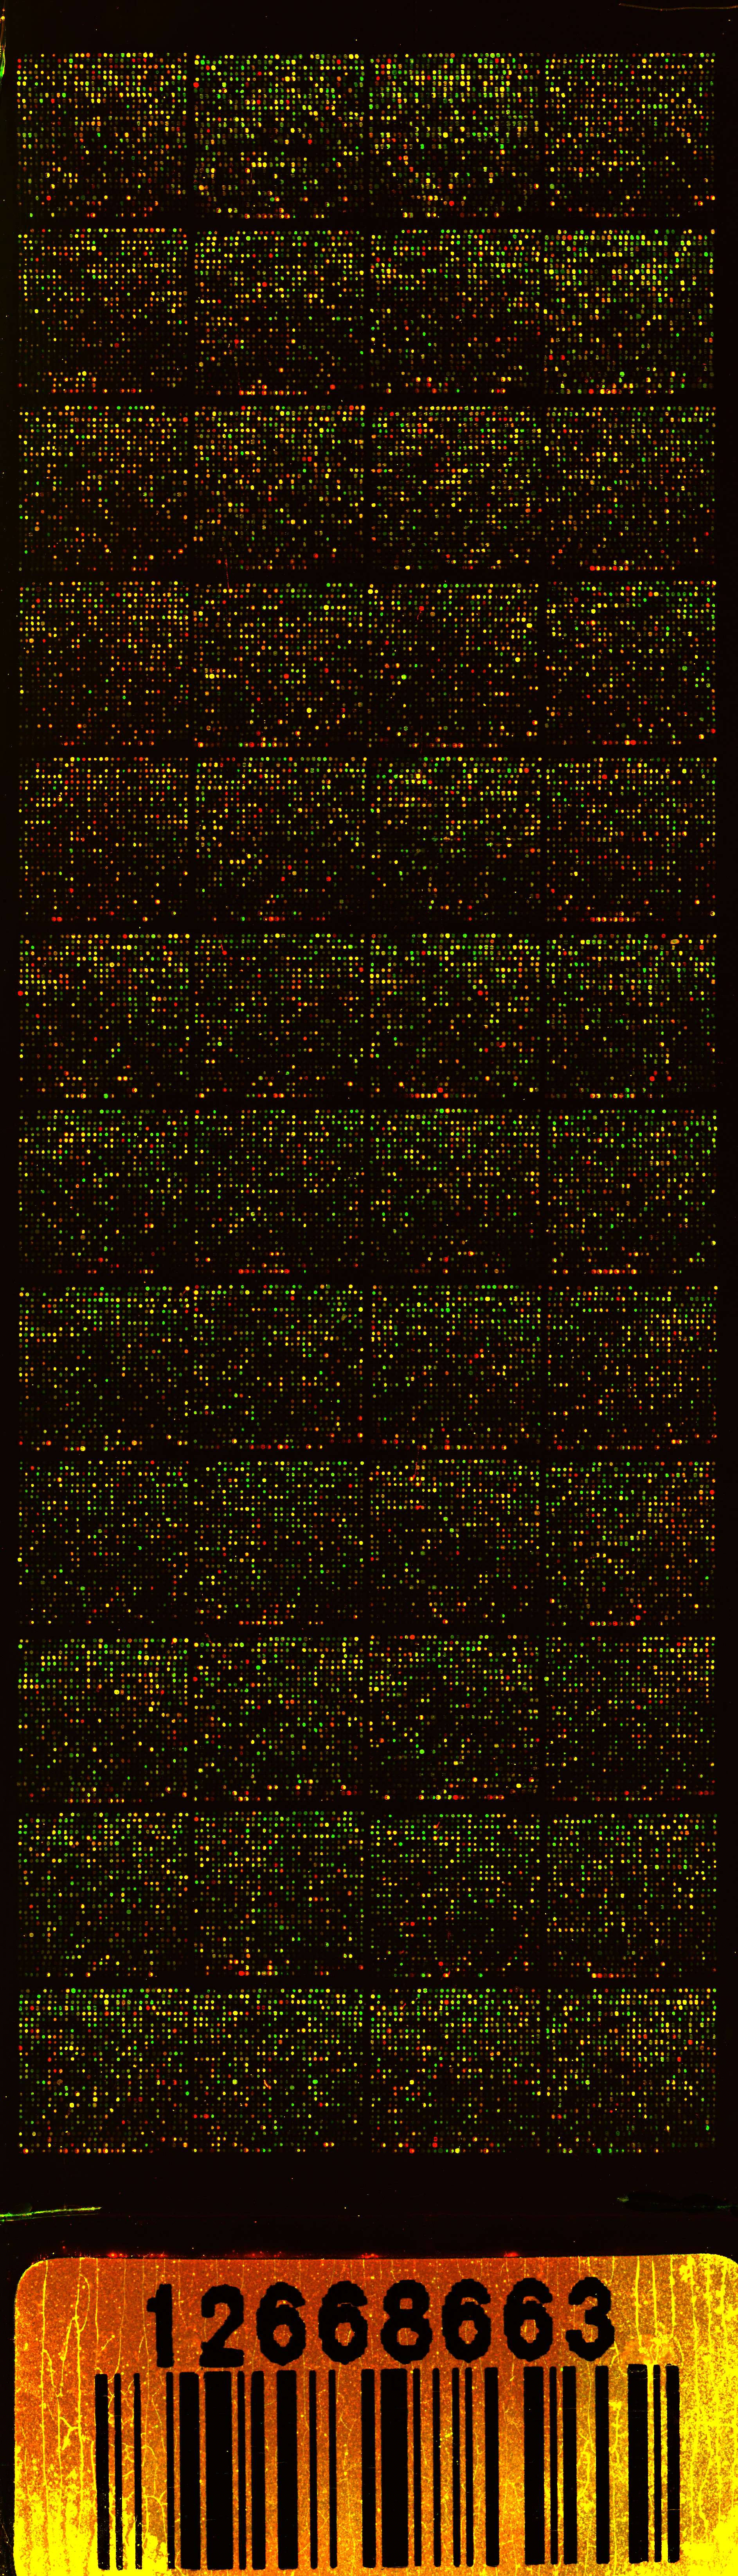
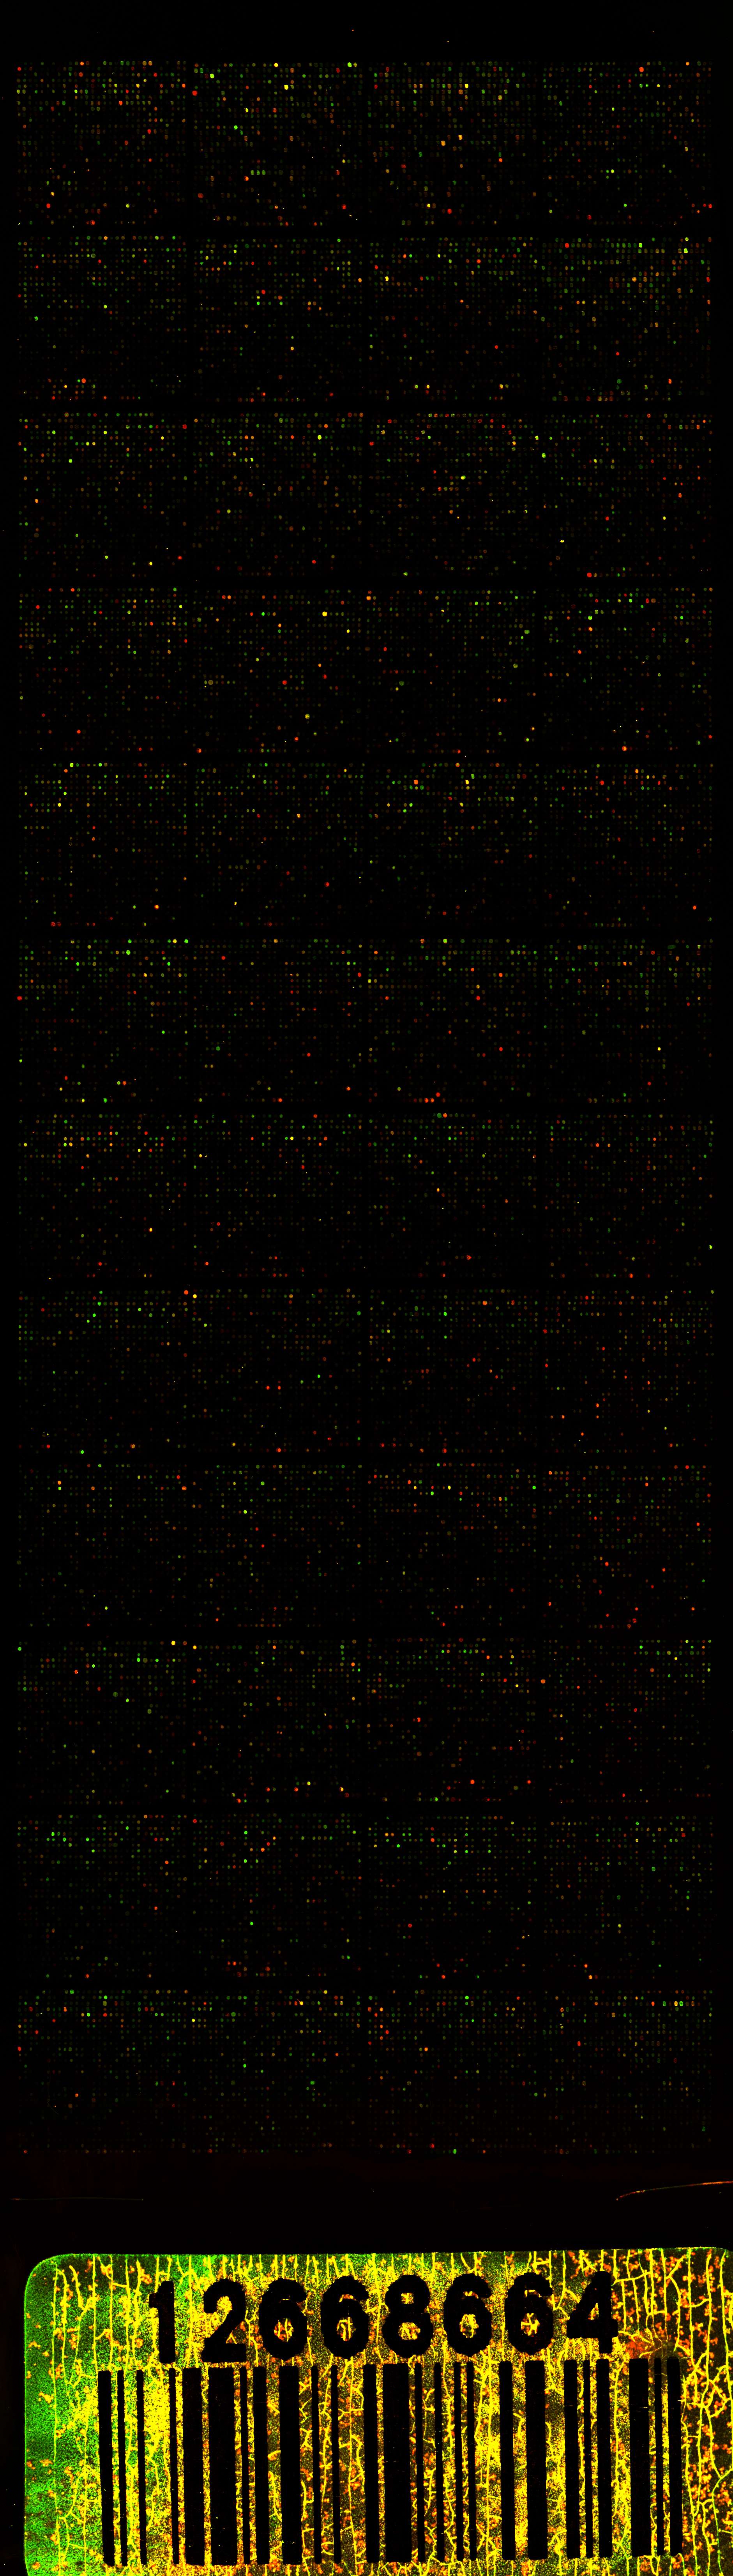
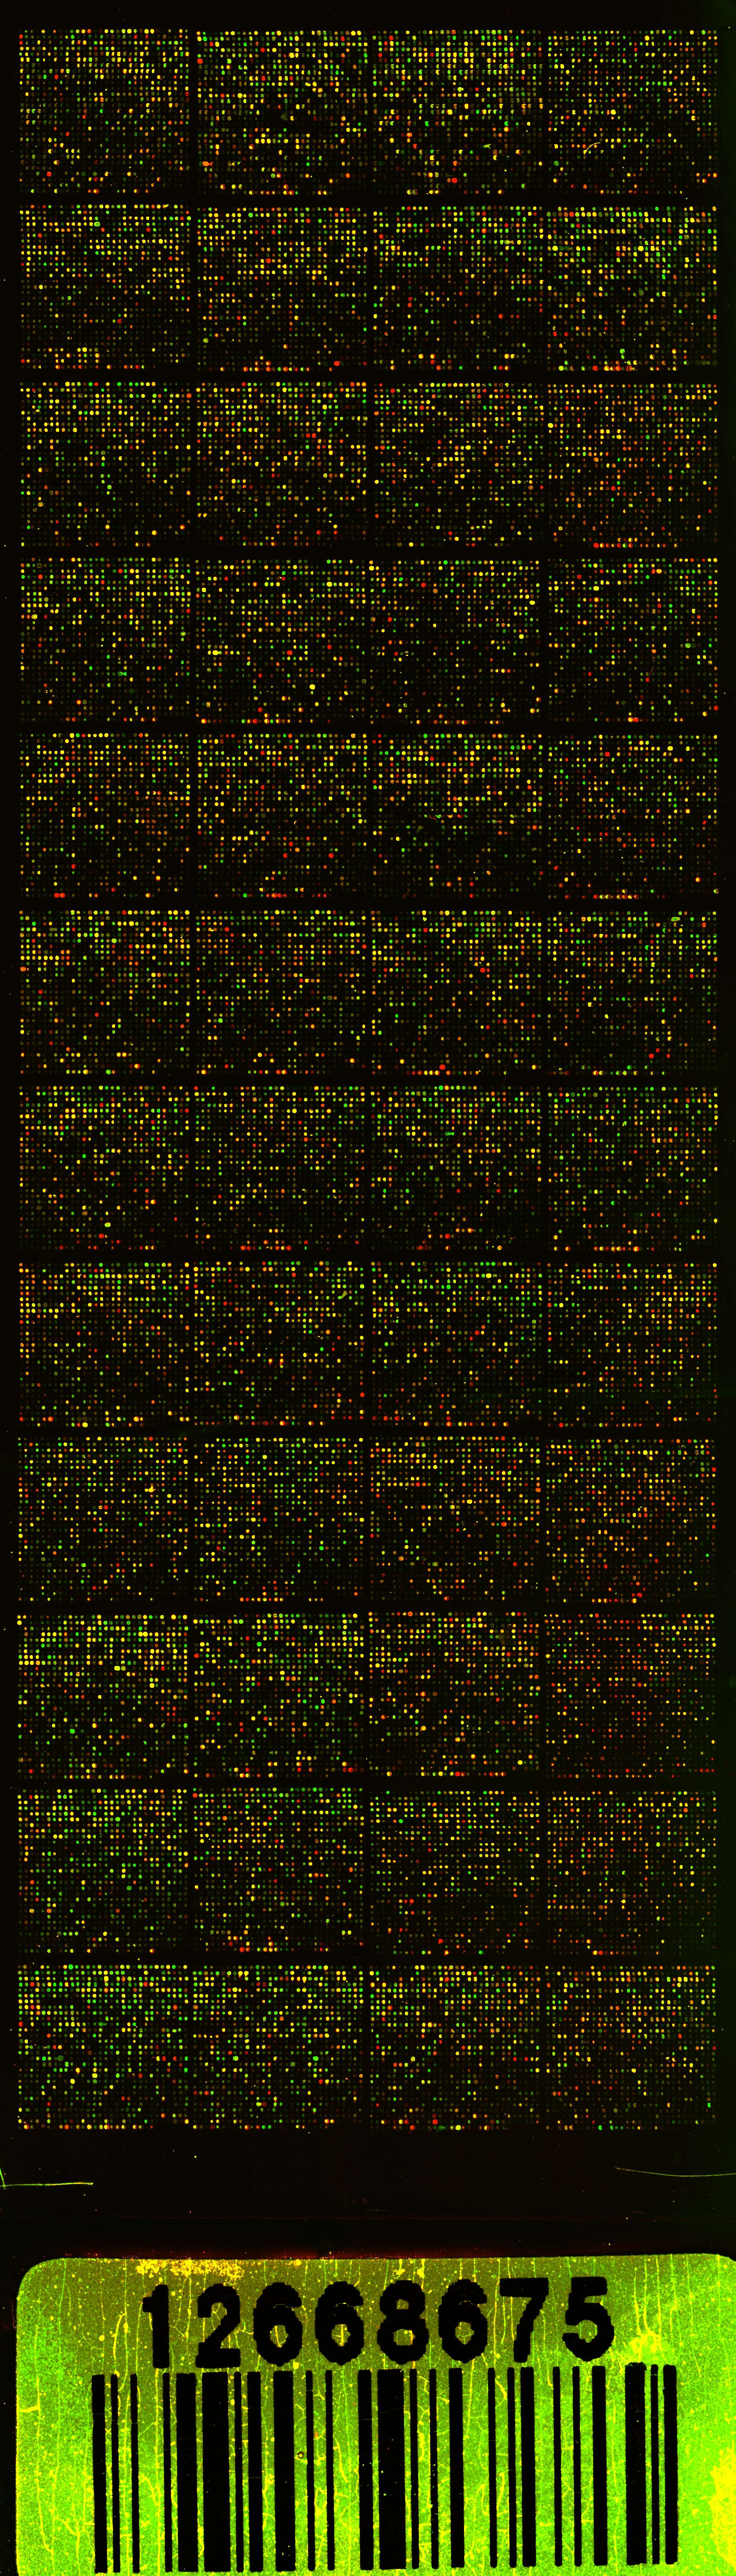
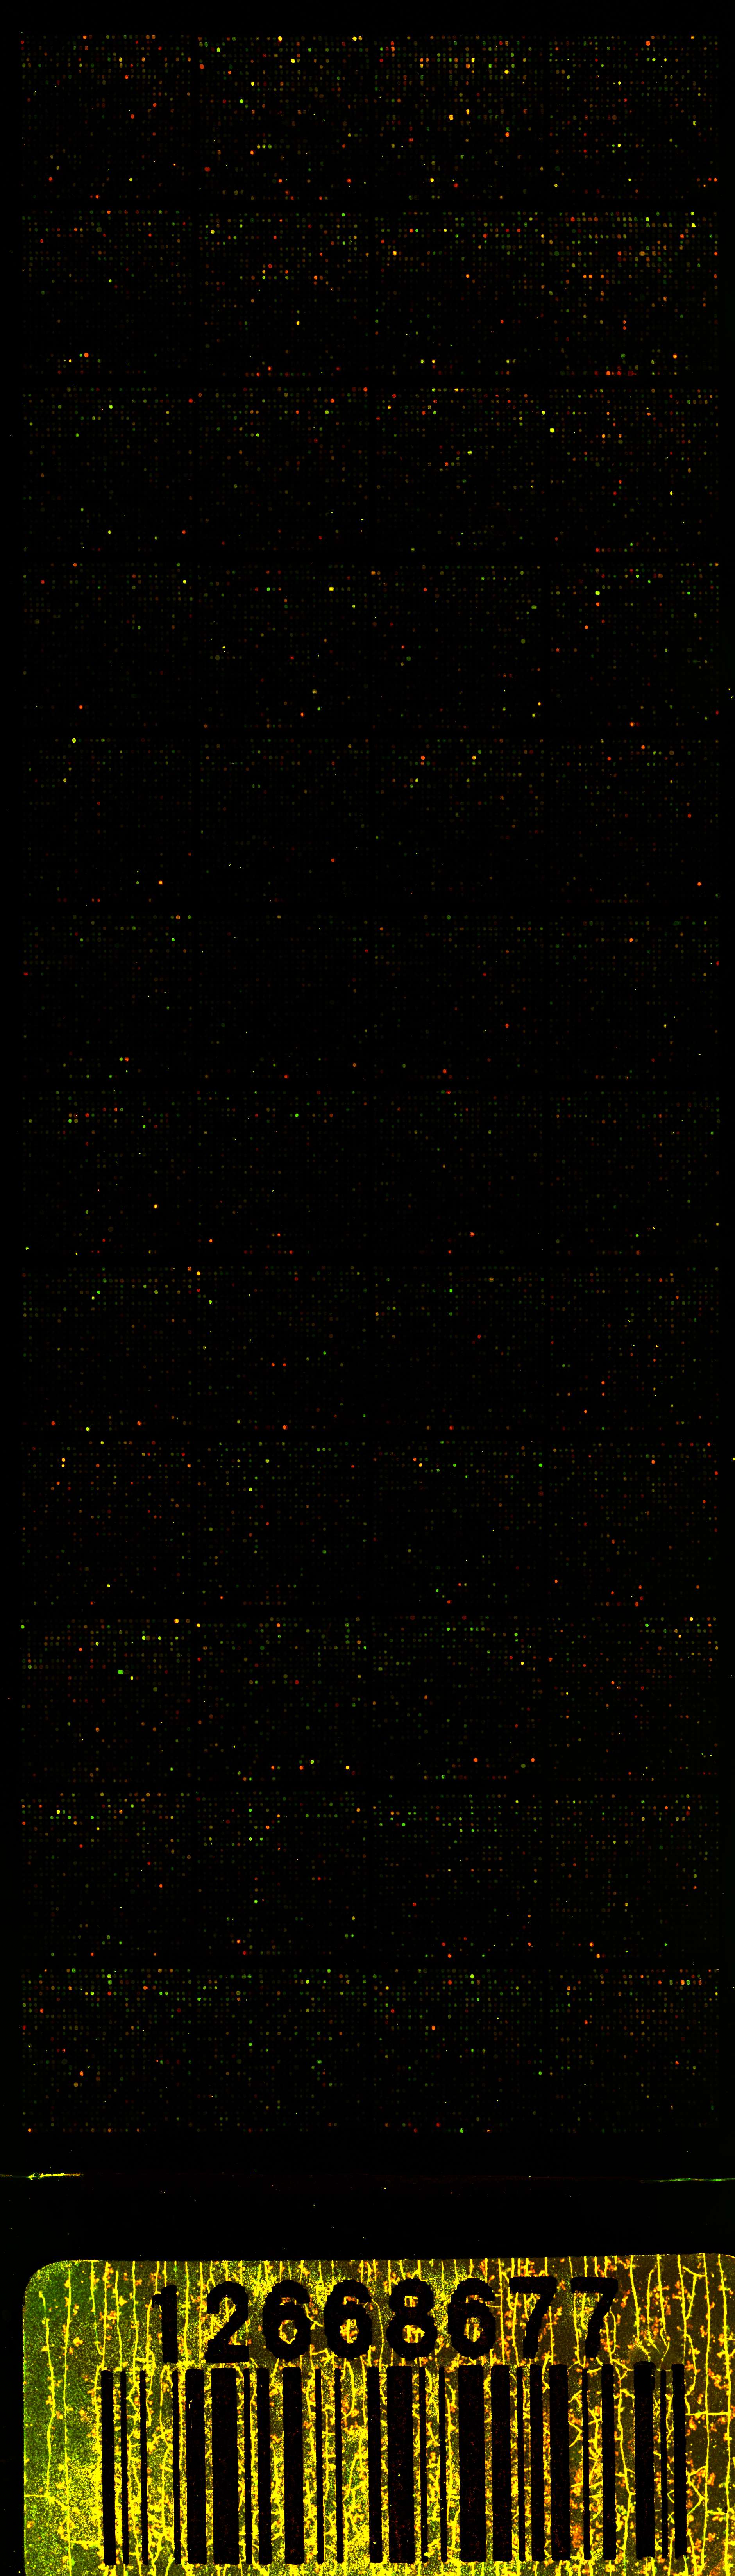
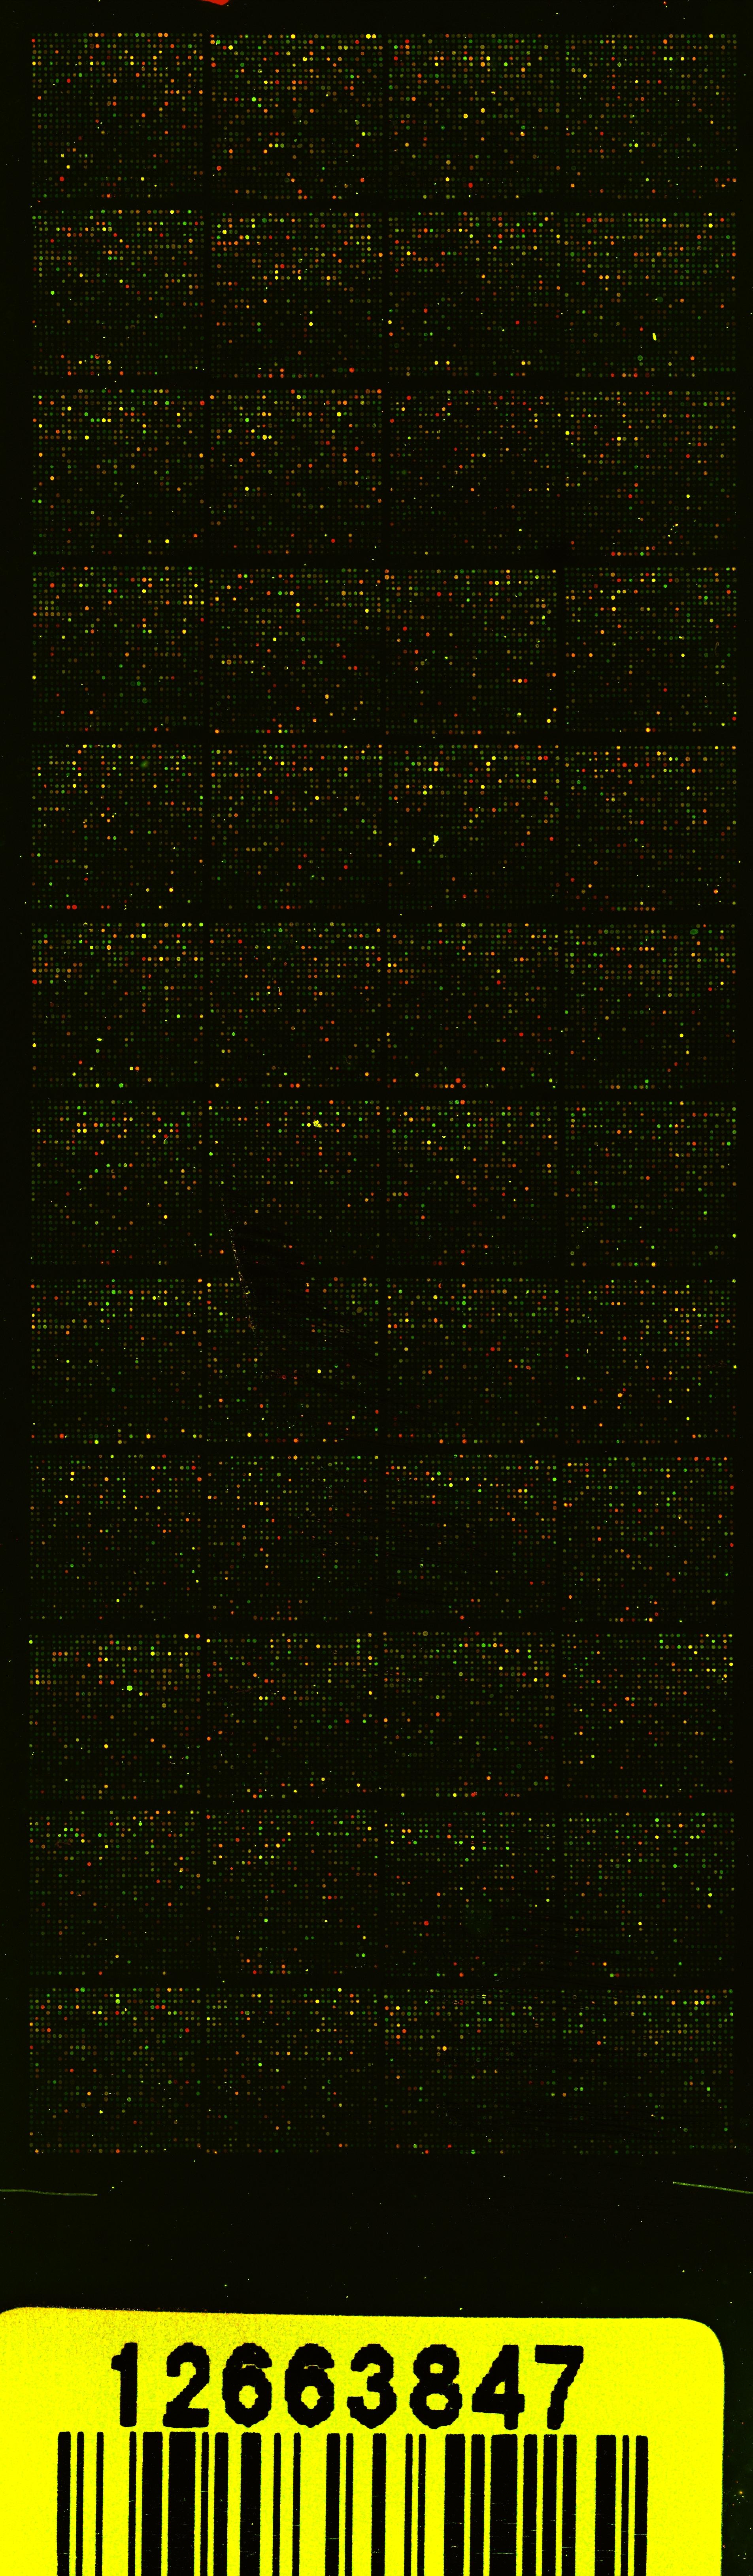
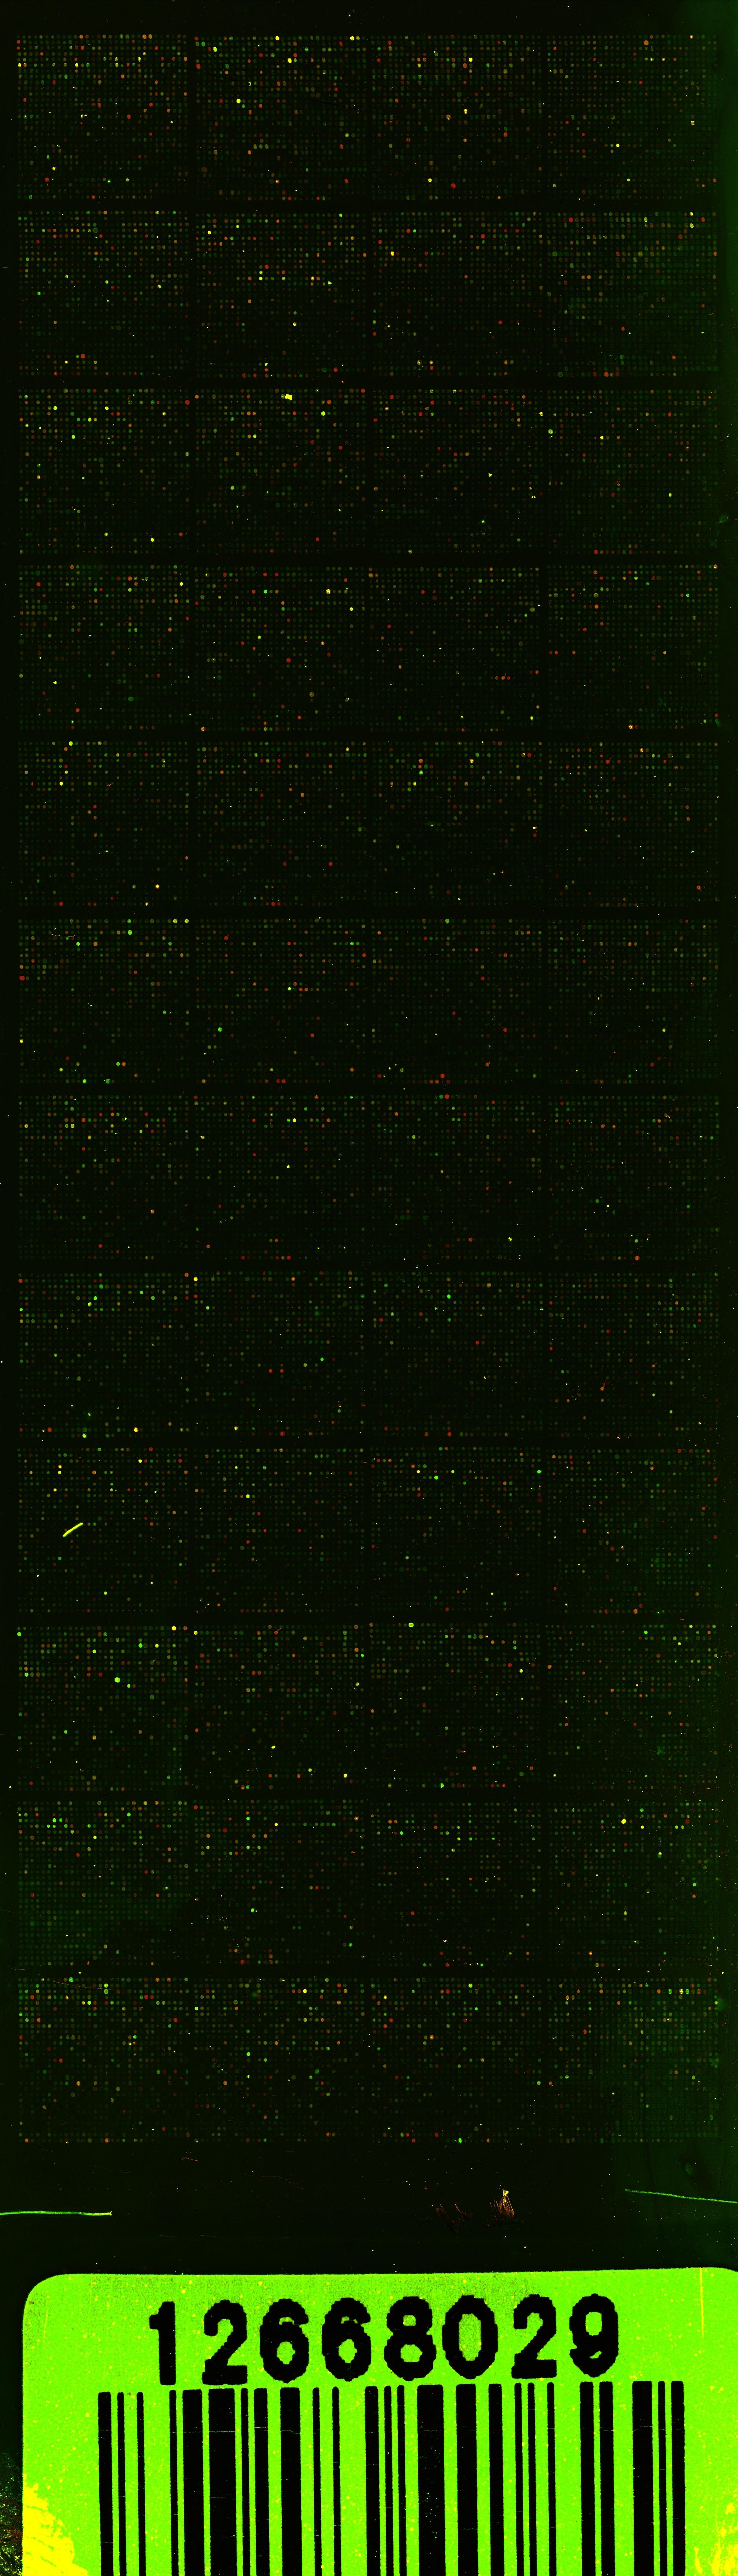
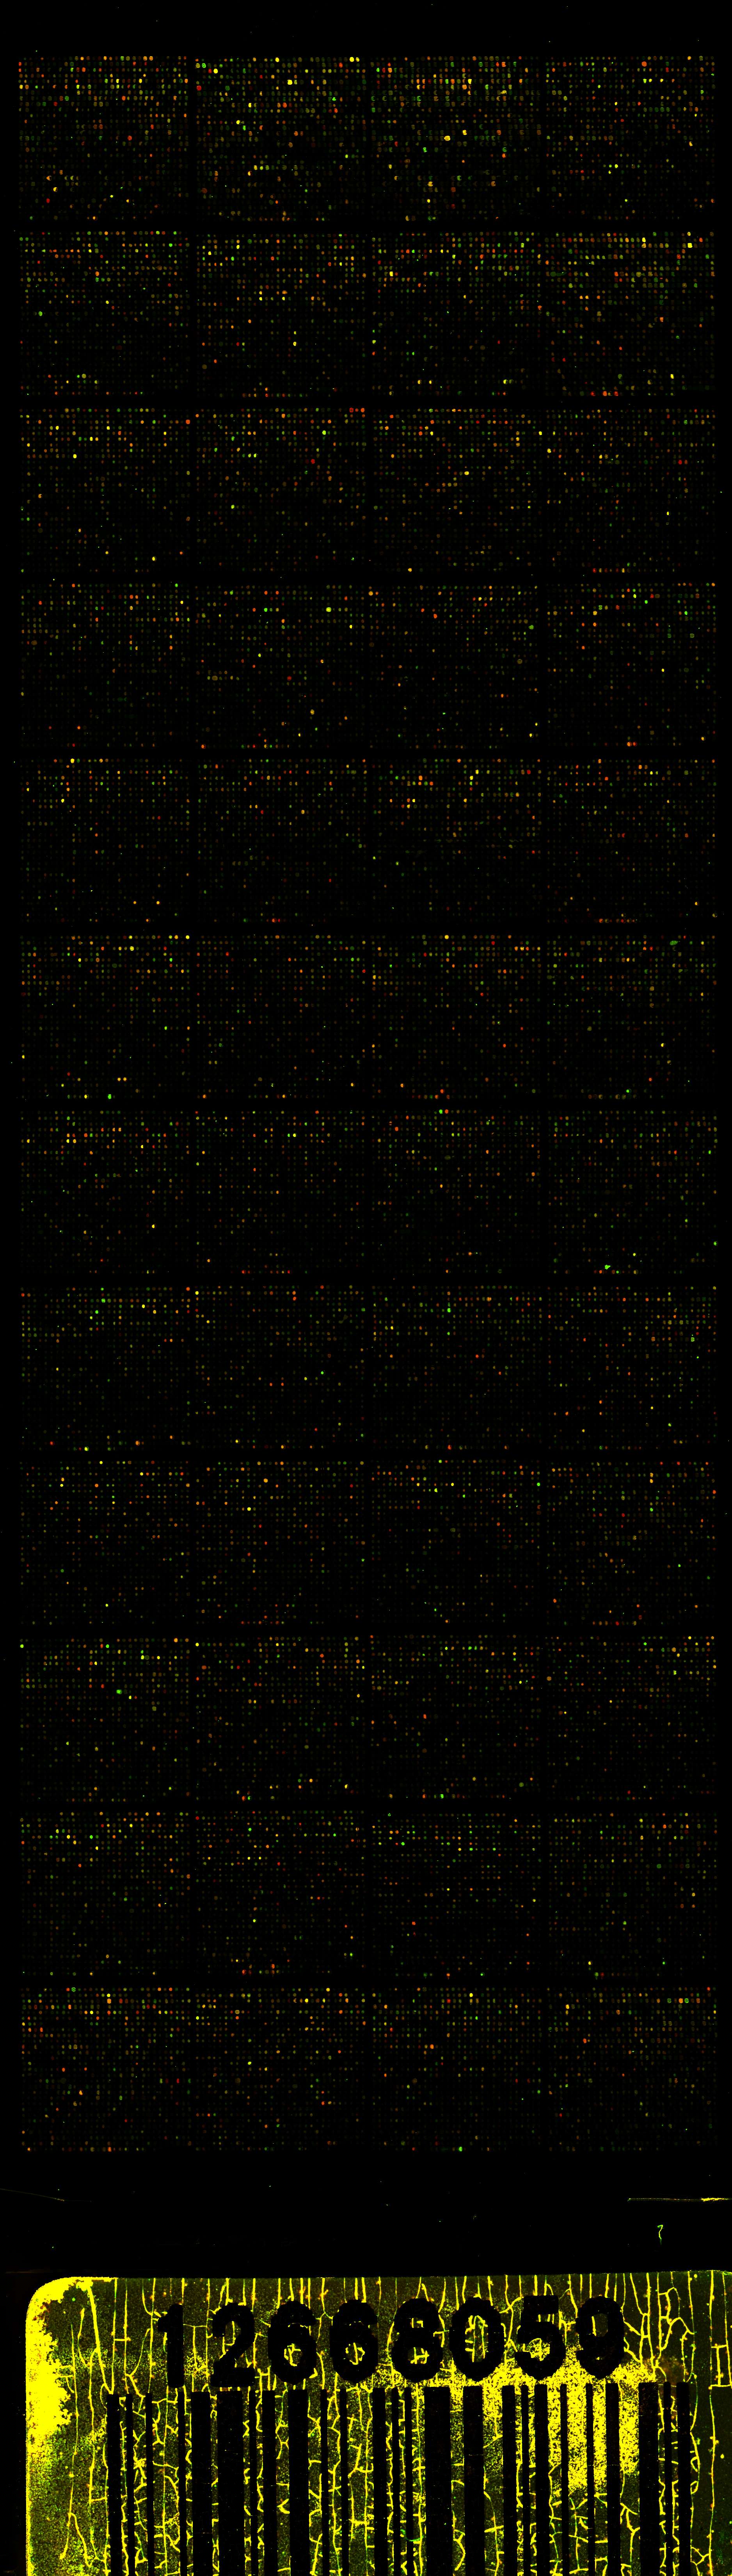
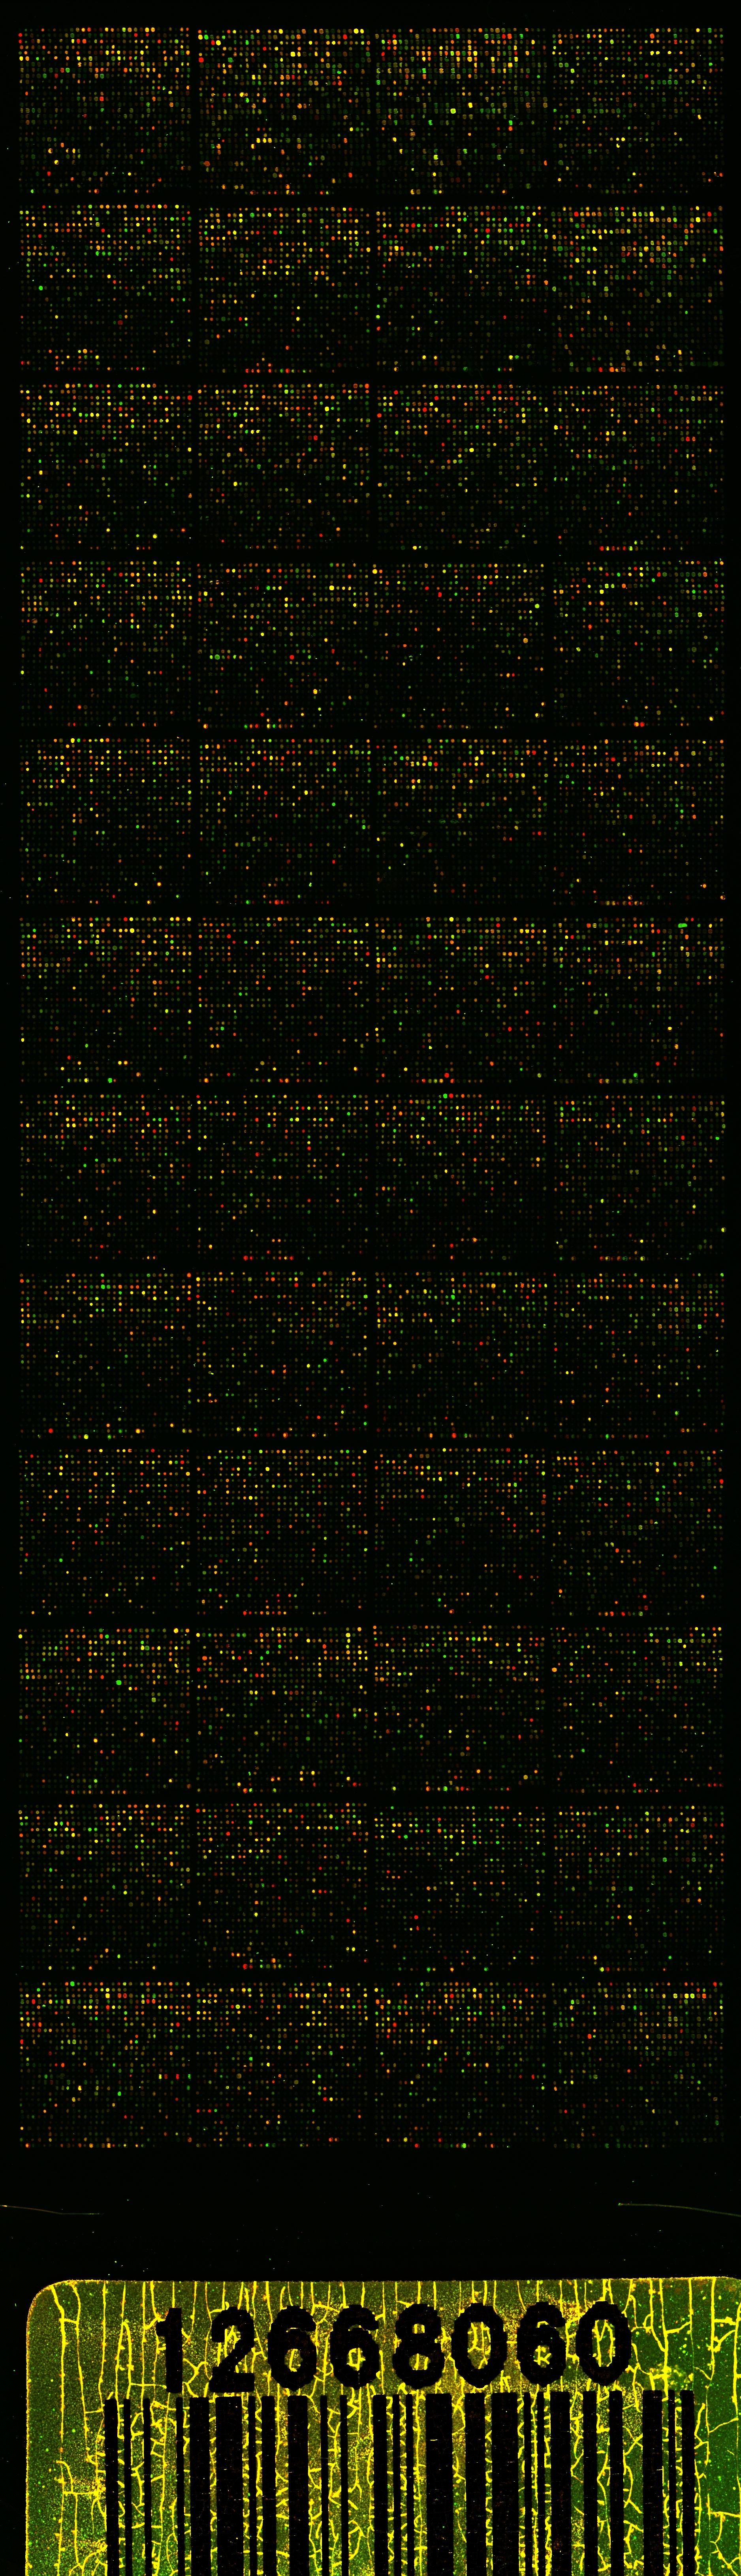
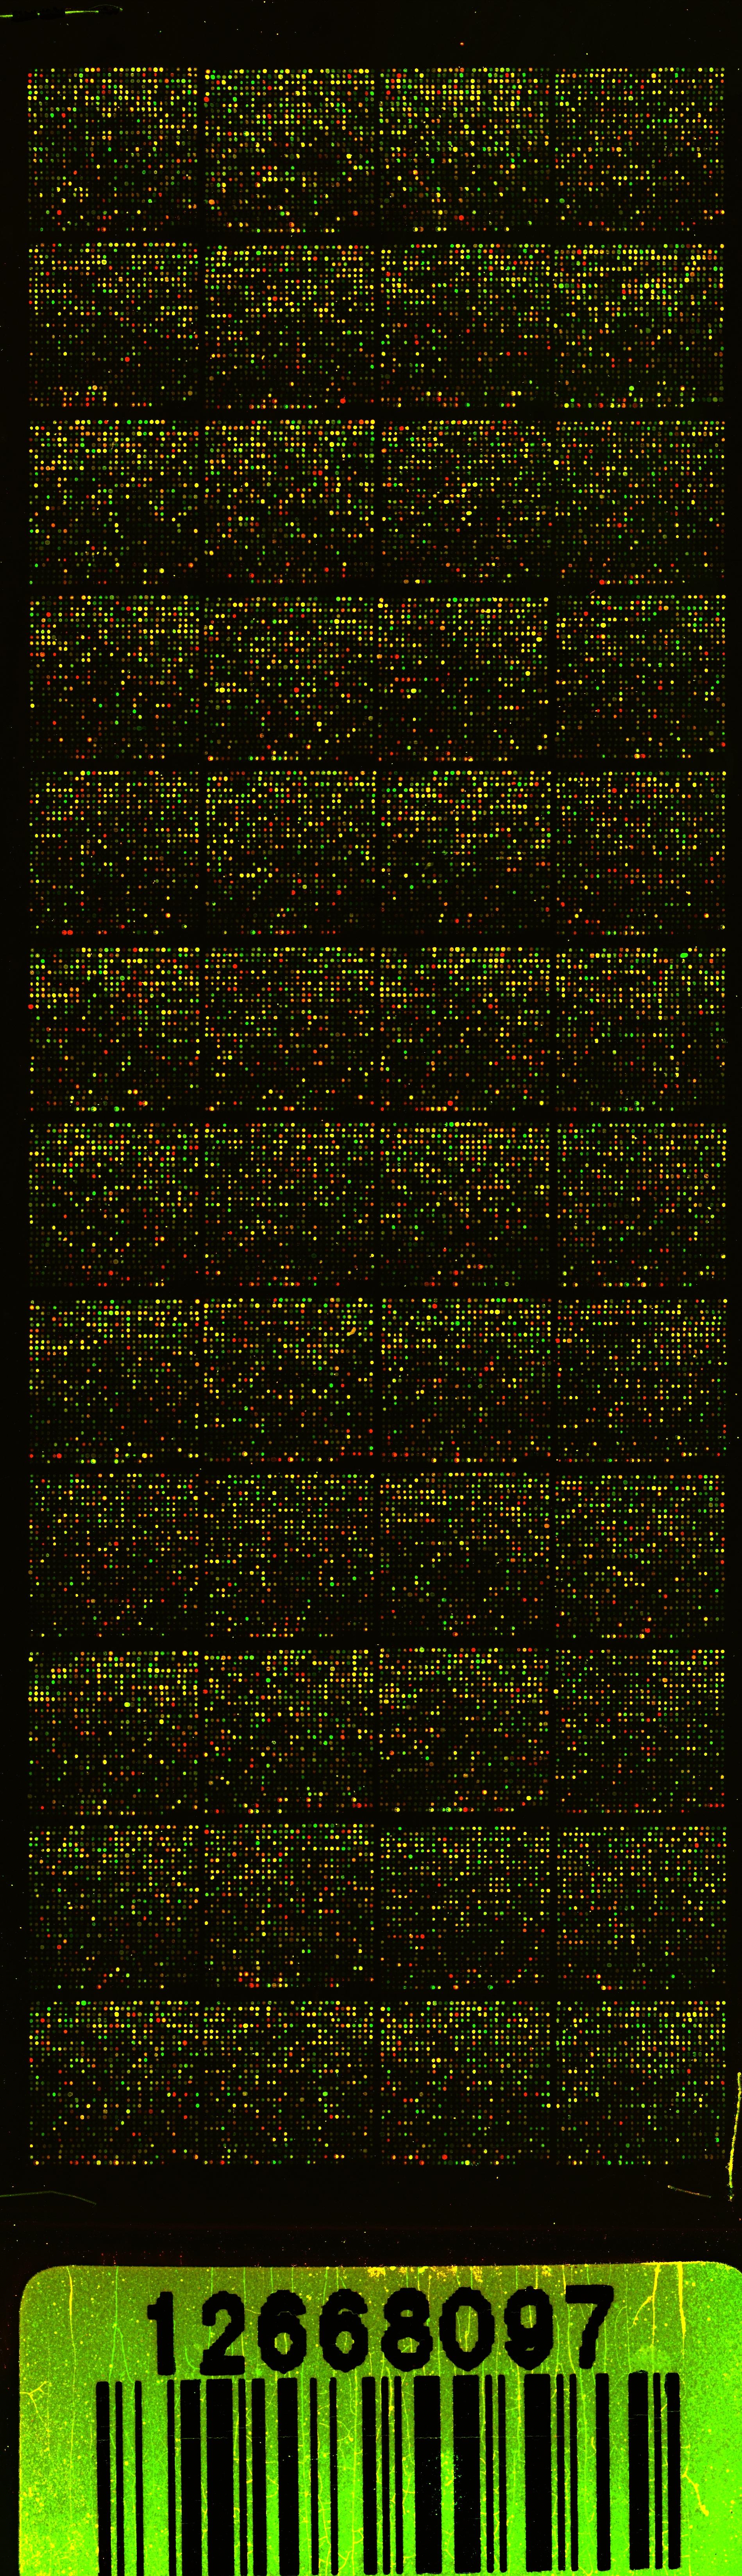
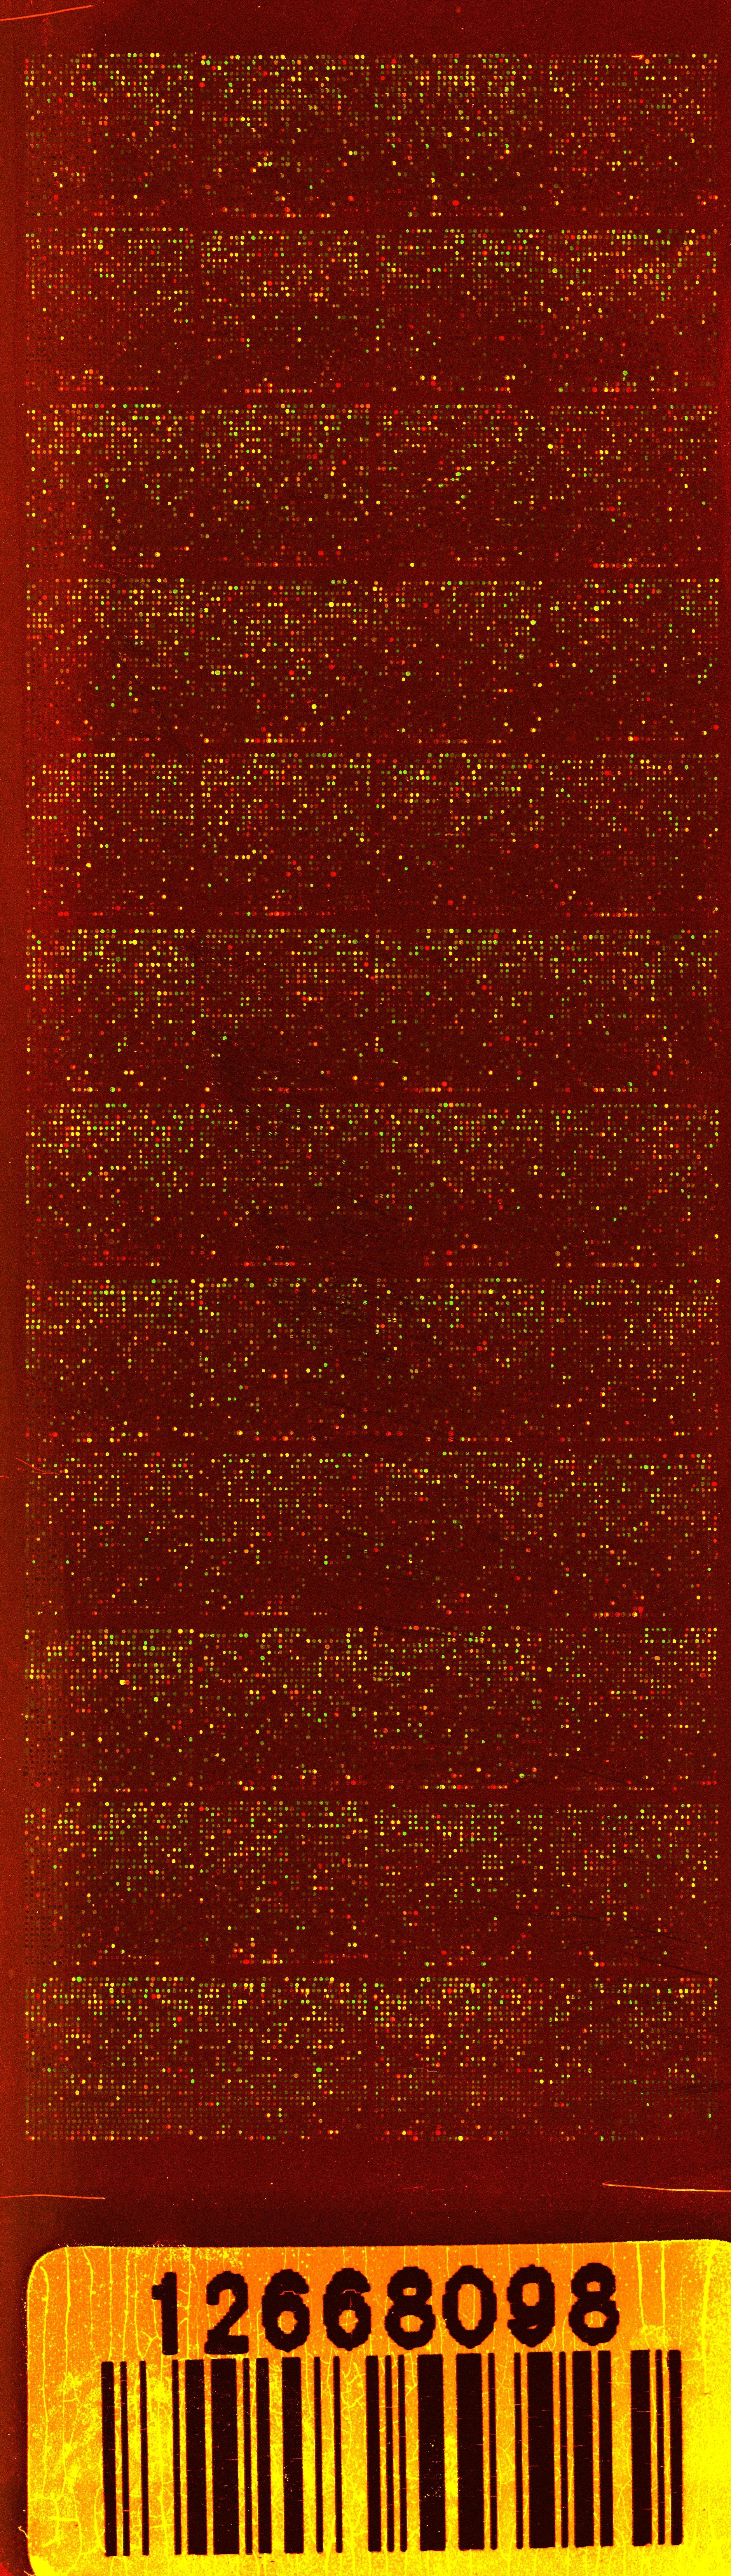
Dendrogram derived by unsupervised hierarchical clustering of gene expression profiles dichotomizing DGF group (orange bar) from PF (blue bar), all received steroid pretreatment. Red spots indicate upregulated transcripts, whereas green spots indicate downregulated transcripts relative to the reference RNA used. The differentially regulated genes associated with DGF could be categorized according to Gene Ontologies (GO) mainly into Transport and Metabolism.
View PDF
Functional classification of differentially expressed genes (DEGs) using PANTHER ontologies: Over- or under-represented biological processes separating delayed graft function (DGF) and primary graft function (PF) as derived on the level of differential gene expression by t-test and SAM. Categories are ranked by the p-value (comparison of expected number of genes and observed number of genes in each biological process) indicating the relevance of a particular process.
View PDF
Seven identified networks with at least two differentially regulated genes between DGF and PF samples. Red nodes depict upregulated genes in DGF samples whereas green nodes depict downregulated genes. Differentially expressed proteins showed a high connectivity in these networks, thus indicating concerted interaction and relevance in the development of DGF.
View PDF
Sixty-three differentially regulated transcripts computed with the Significance Analysis of Microarrays (SAM) method sorted by fold–change values. The number of permutations in the SAM method was set to twenty-thousand and a false discovery rate of 2.5% was selected.
View PDF
147 differentially regulated transcripts computed with the Student’s t-Test sorted by fold-change values. The p-value threshold was set to < 0.05 with fold-change values greater than two.
View PDF
Original data according to MiAME Guidelines
View PDFArray experiment: