
J. Wilflingseder(1), A. Kainz(1,2), P. Perco(2,3), B. Mayer(3), R. Oberbauer(1,2)
1- Department of Nephrology, KH Elisabethinen, Linz, Austria
2- Department of Nephrology, Medical University of Vienna, Austria
3- emergentec biodevelopment GmbH, Vienna, Austria

Demographic data of patients comparing ESA positive case and ESA negative control group. Continuous data are given as median and interquartile range. Categorical data are shown as counts or fractions. Significant p-values are given in bold.
View PDF
Dendrogram derived by applying unsupervised hierarchical clustering on the basis of the expression profiles characterizing the ESA group (anaemia within the first year after transplantation, orange bar) and the non-ESA group (no anaemia within the first year after transplantation, blue bar). Red spots indicate upregulated transcripts, whereas green spots indicate downregulated transcripts relative to the reference RNA used. The 34 differentially expressed genes can be categorized according to PANTHER ontologies into their main biological processes: 1. immunity and defence, 2. endoderm development, 3. protein-lipid modification, 4. amino acid catabolism, 5. protein complex assembly, 6. carbon metabolism, 7. transport, 8. protein ADP-ribosylation, and 9. signal transduction.
View PDF
Multivariate logistic regression model. The discriminative power of this model is indicated by a cross-validation c-statistics of 0.93 (AUC). Given is the odds ratio (OR), the confidence interval, and the p-values.
View PDF
Given is the largest protein-protein interaction subnetwork holding genes exhibiting differential expression further including protein interaction partners derived from OPHID. Blue nodes (38 features) indicate down-regulated genes and red nodes (40 features) denote up-regulated genes as found in the ESA positive group. Gray nodes represent proteins identified by the nearest neighbour expansion method.
View PDF
Discrimination of the models and optimism (3A) derived from the re-sampling procedure (50-fold cross validation). Calibration of the ESA prediction model by the Hosmer-Lemeshow goodness of fit test (3B). The expected to observed number of cases in each of the deciles of patients were not statistically different suggesting good calibration (p=0.88, Chi-square test).
View PDF
ROC curves: Discrimination for ESA need within the first year after transplantation using clinical data (dotted line), expression features (dashed line), or the combination of both (solid line).
View PDF
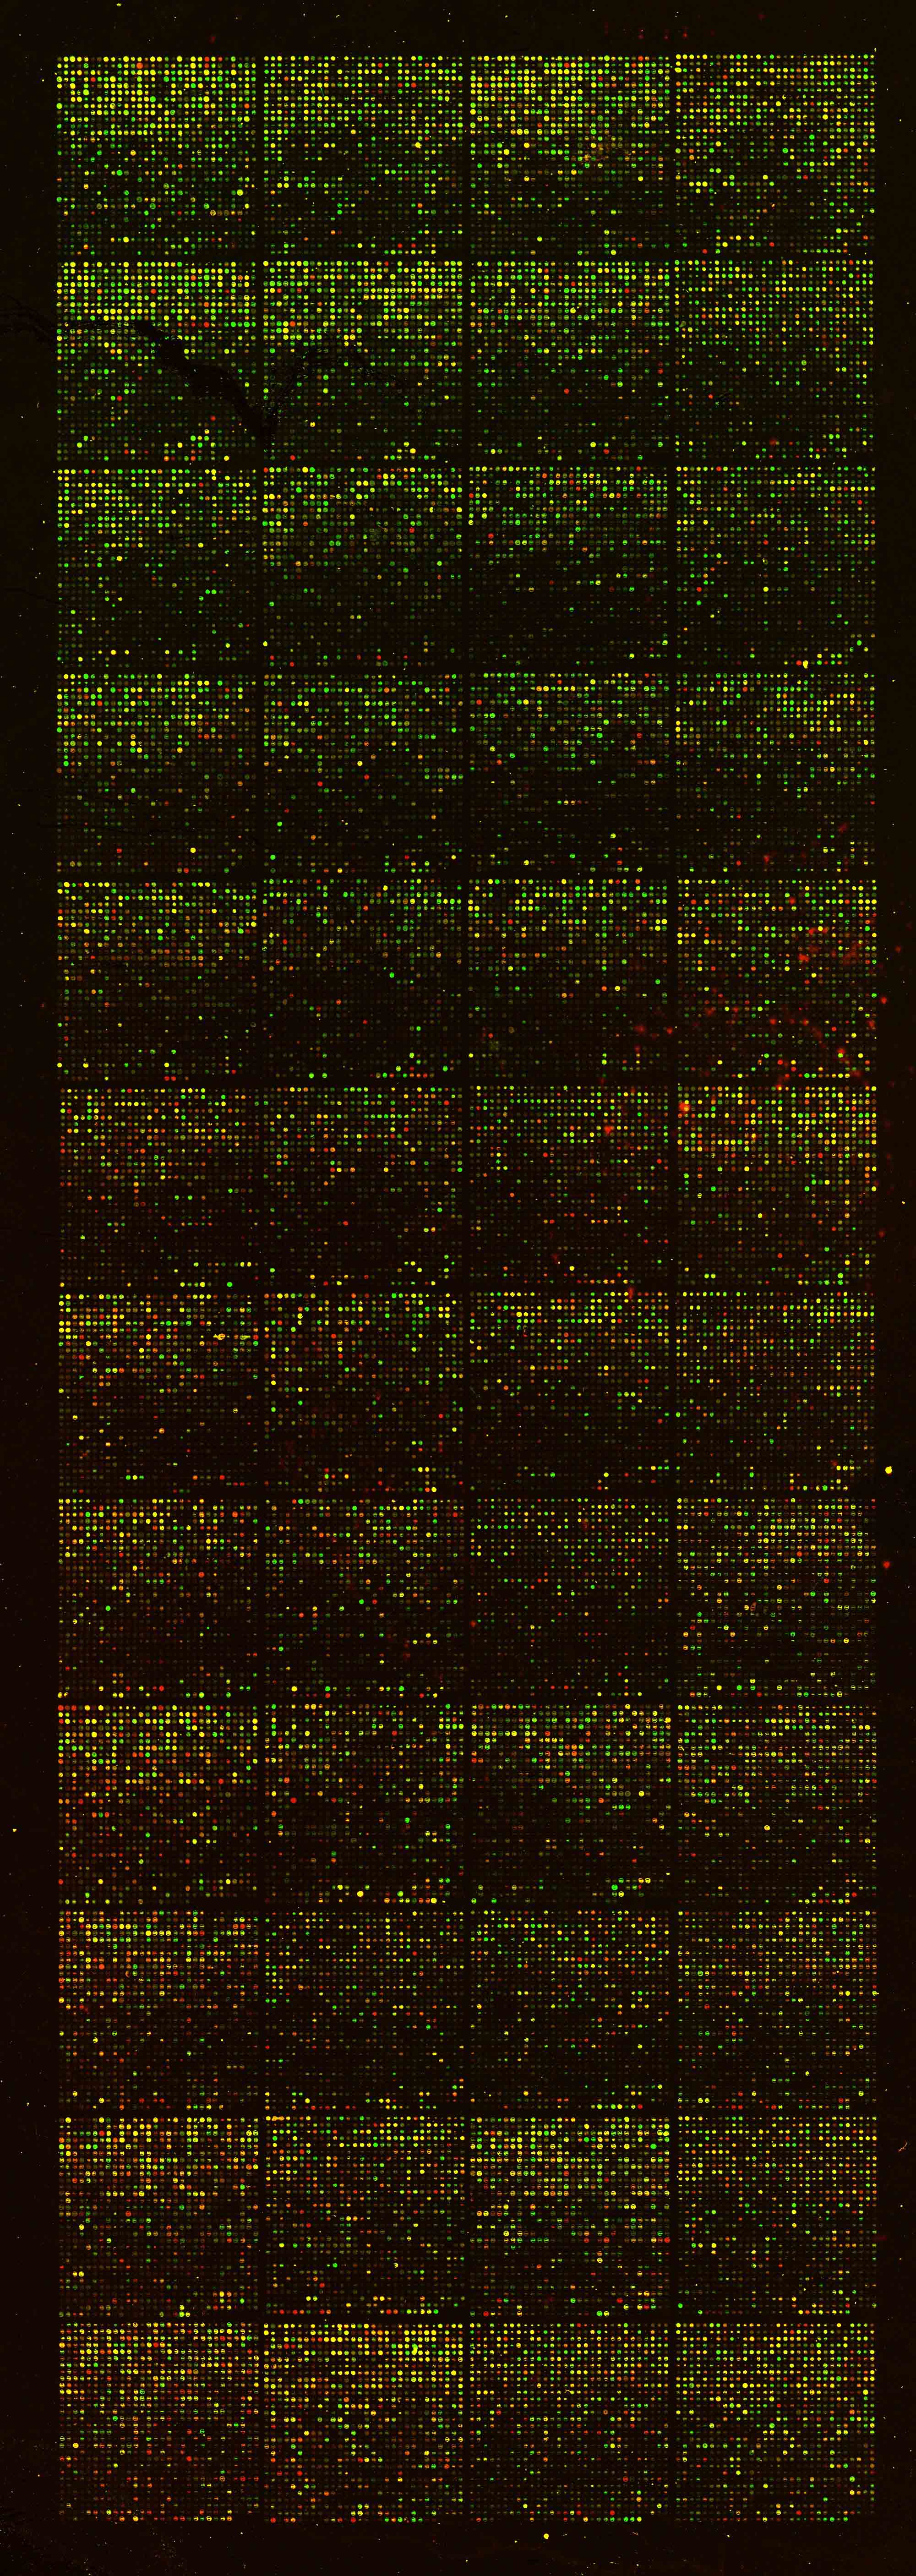
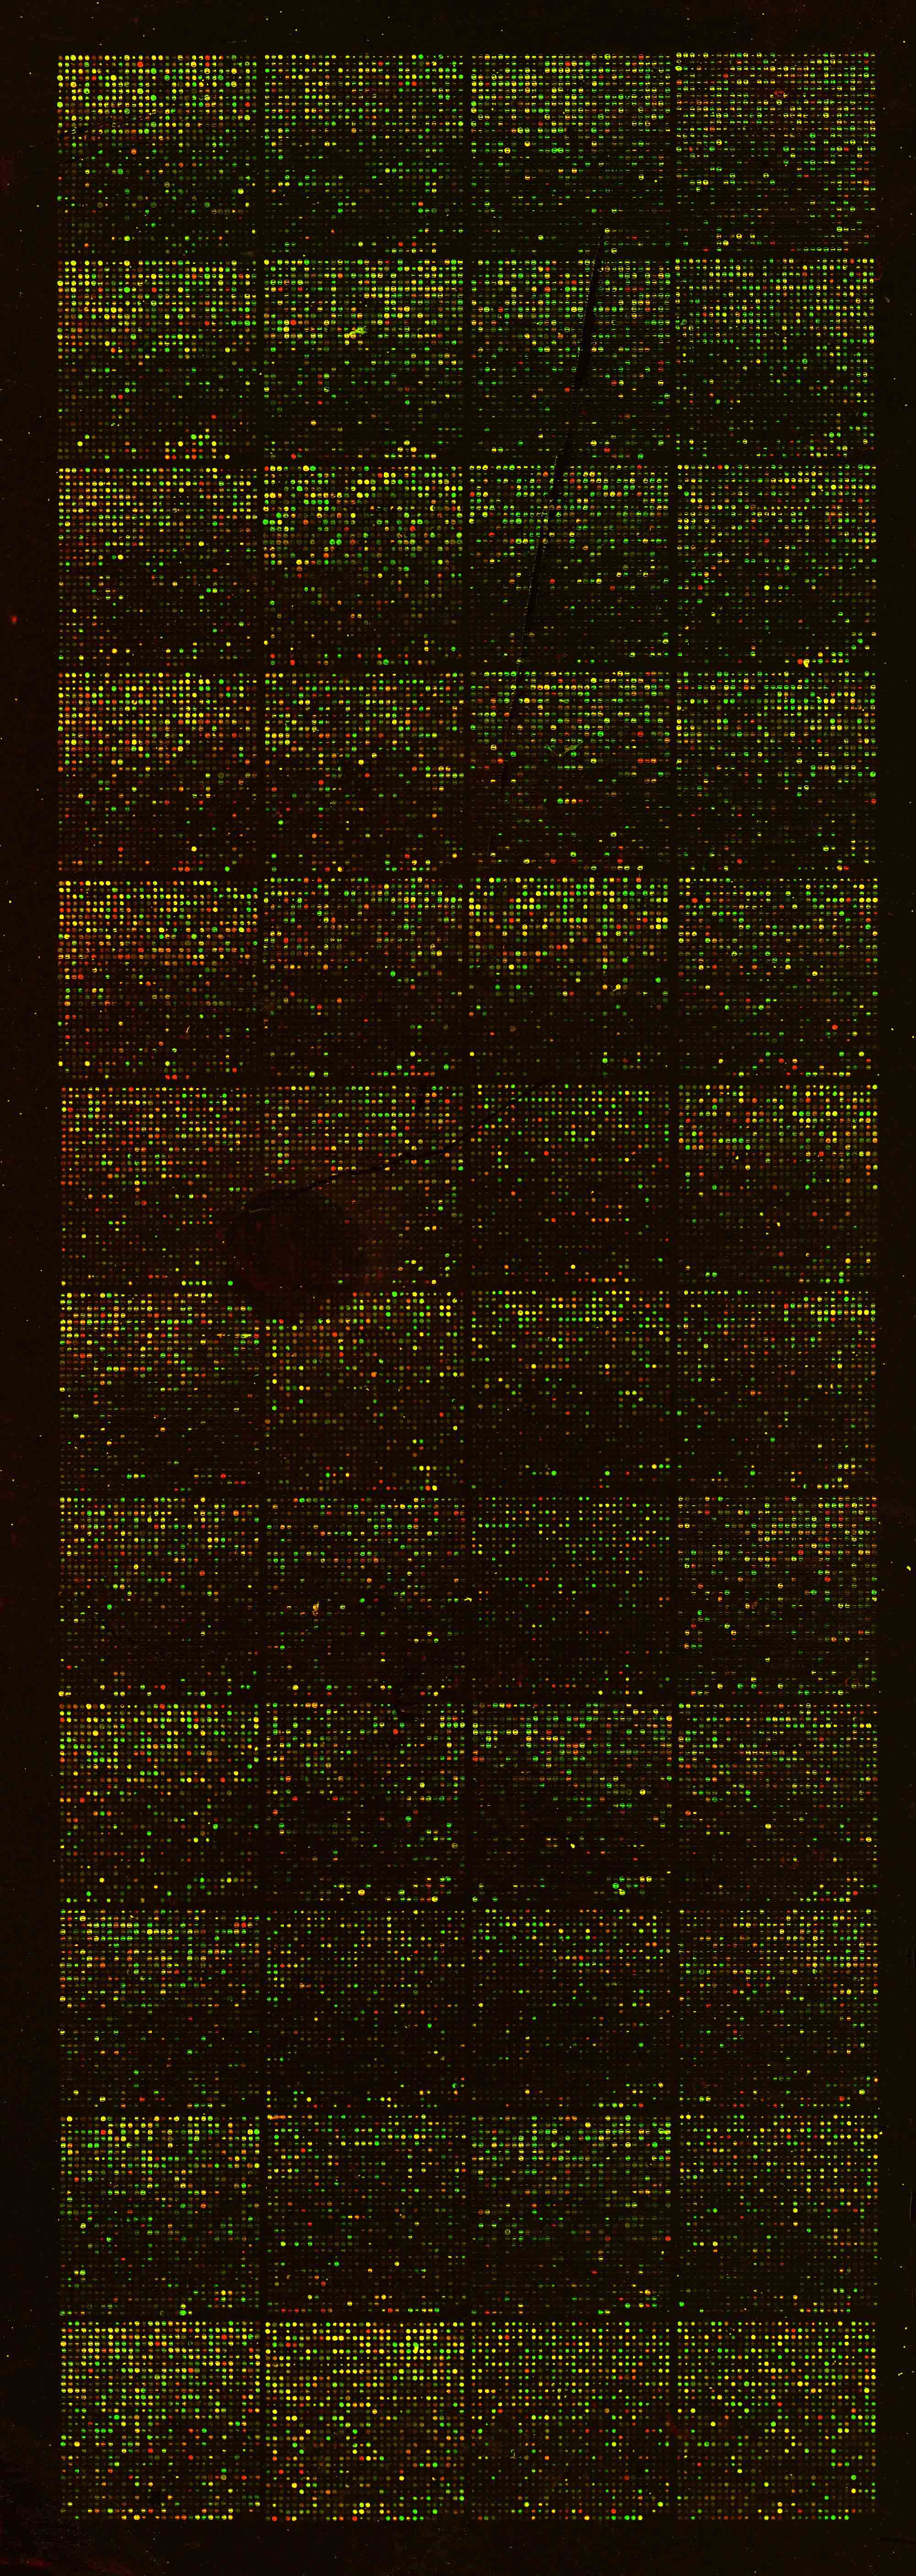
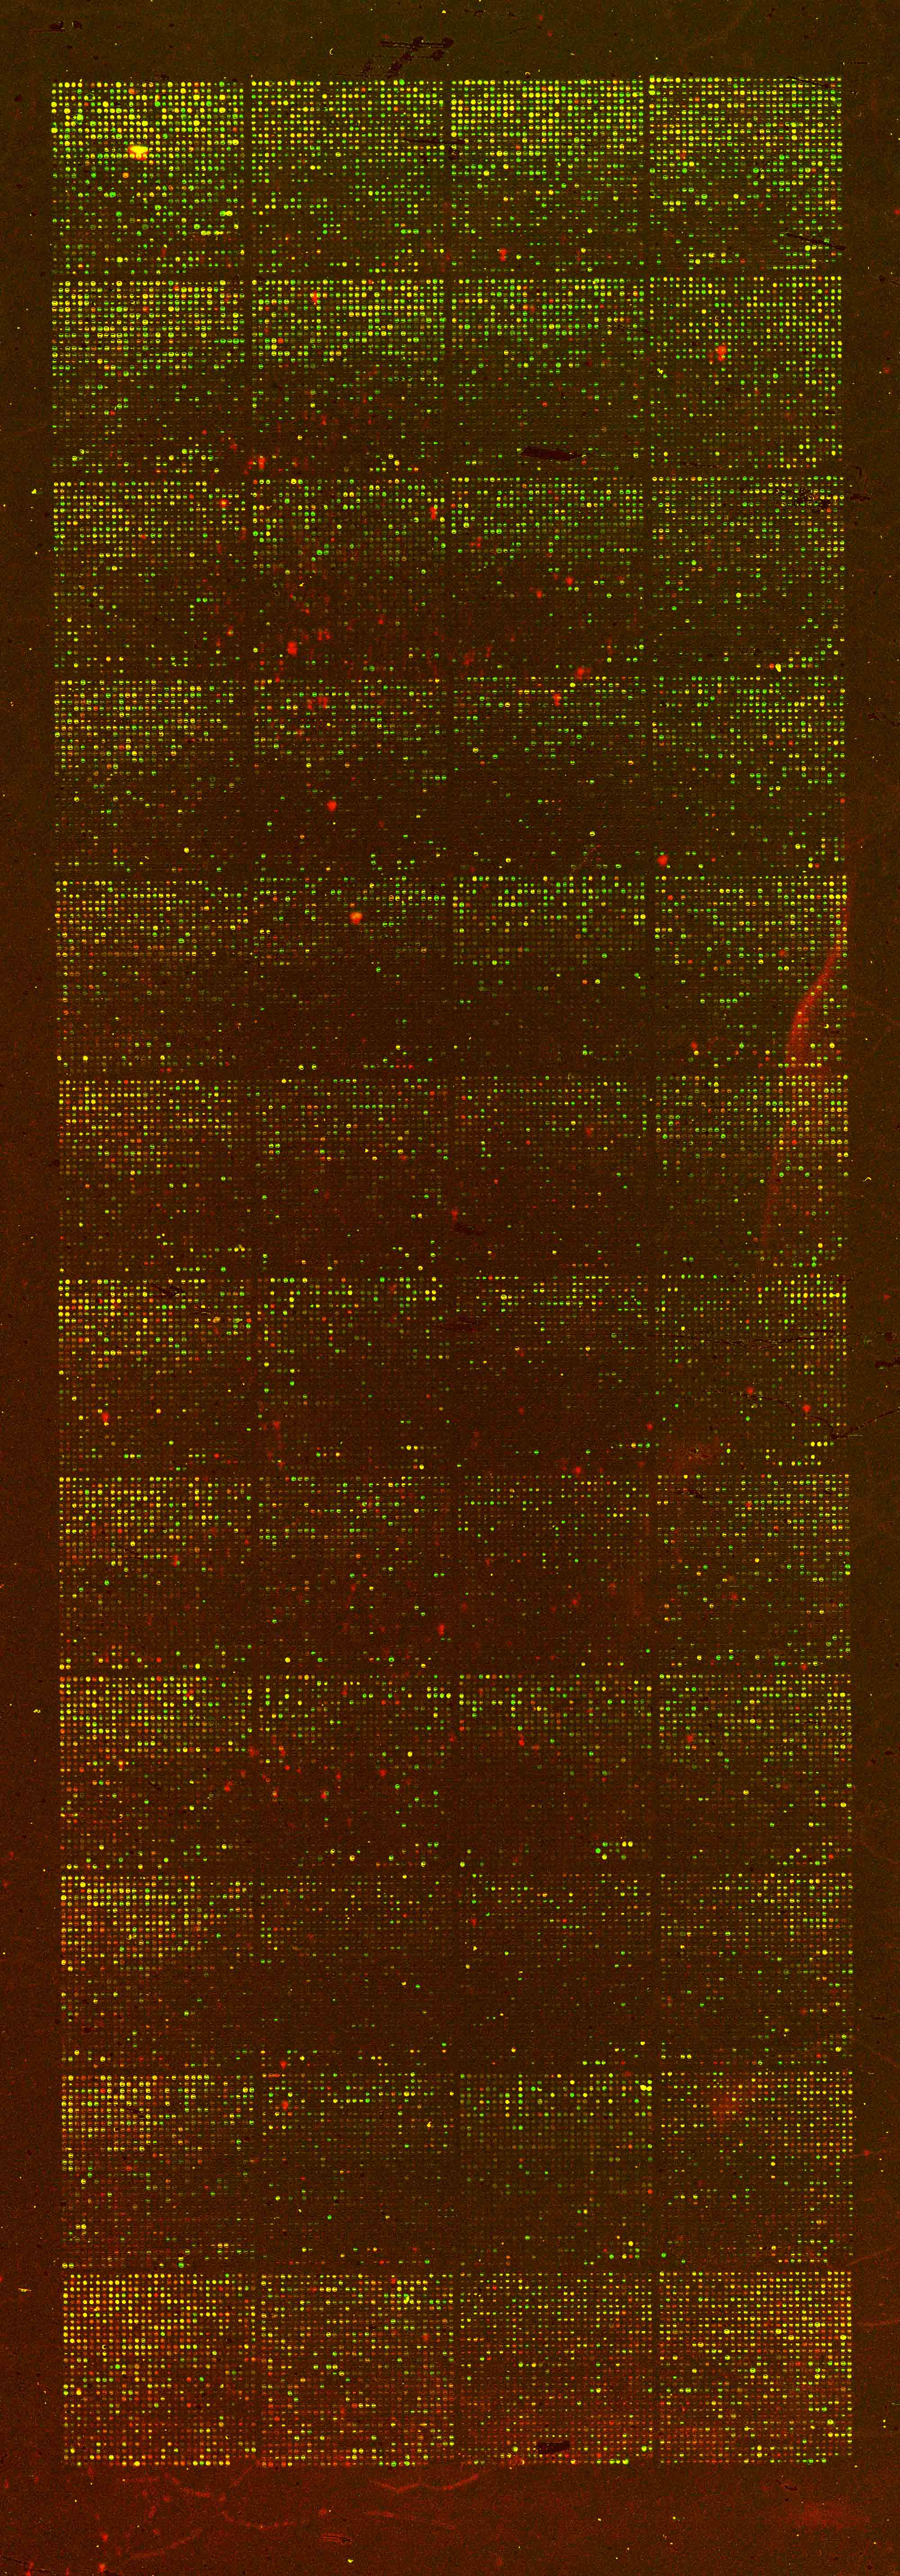
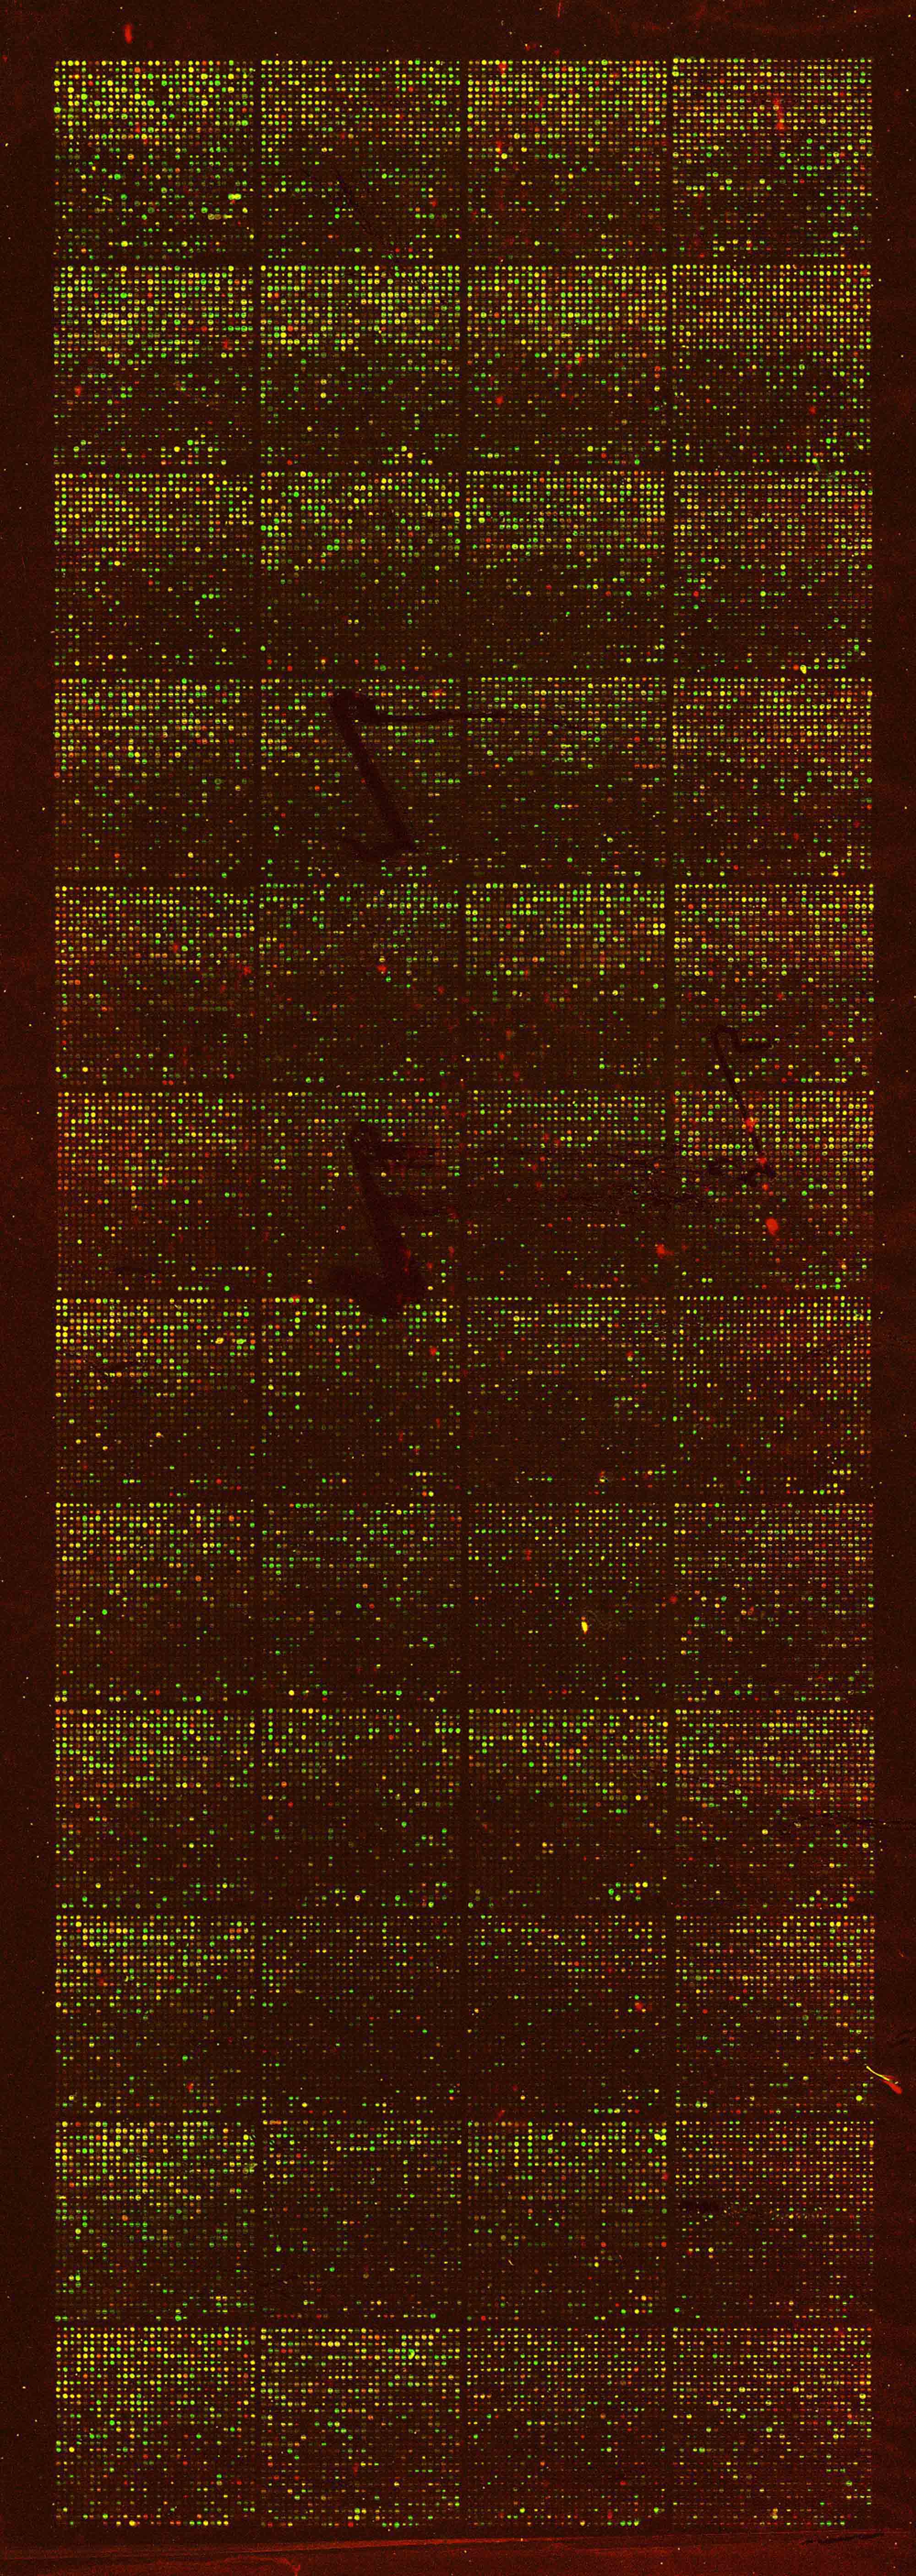
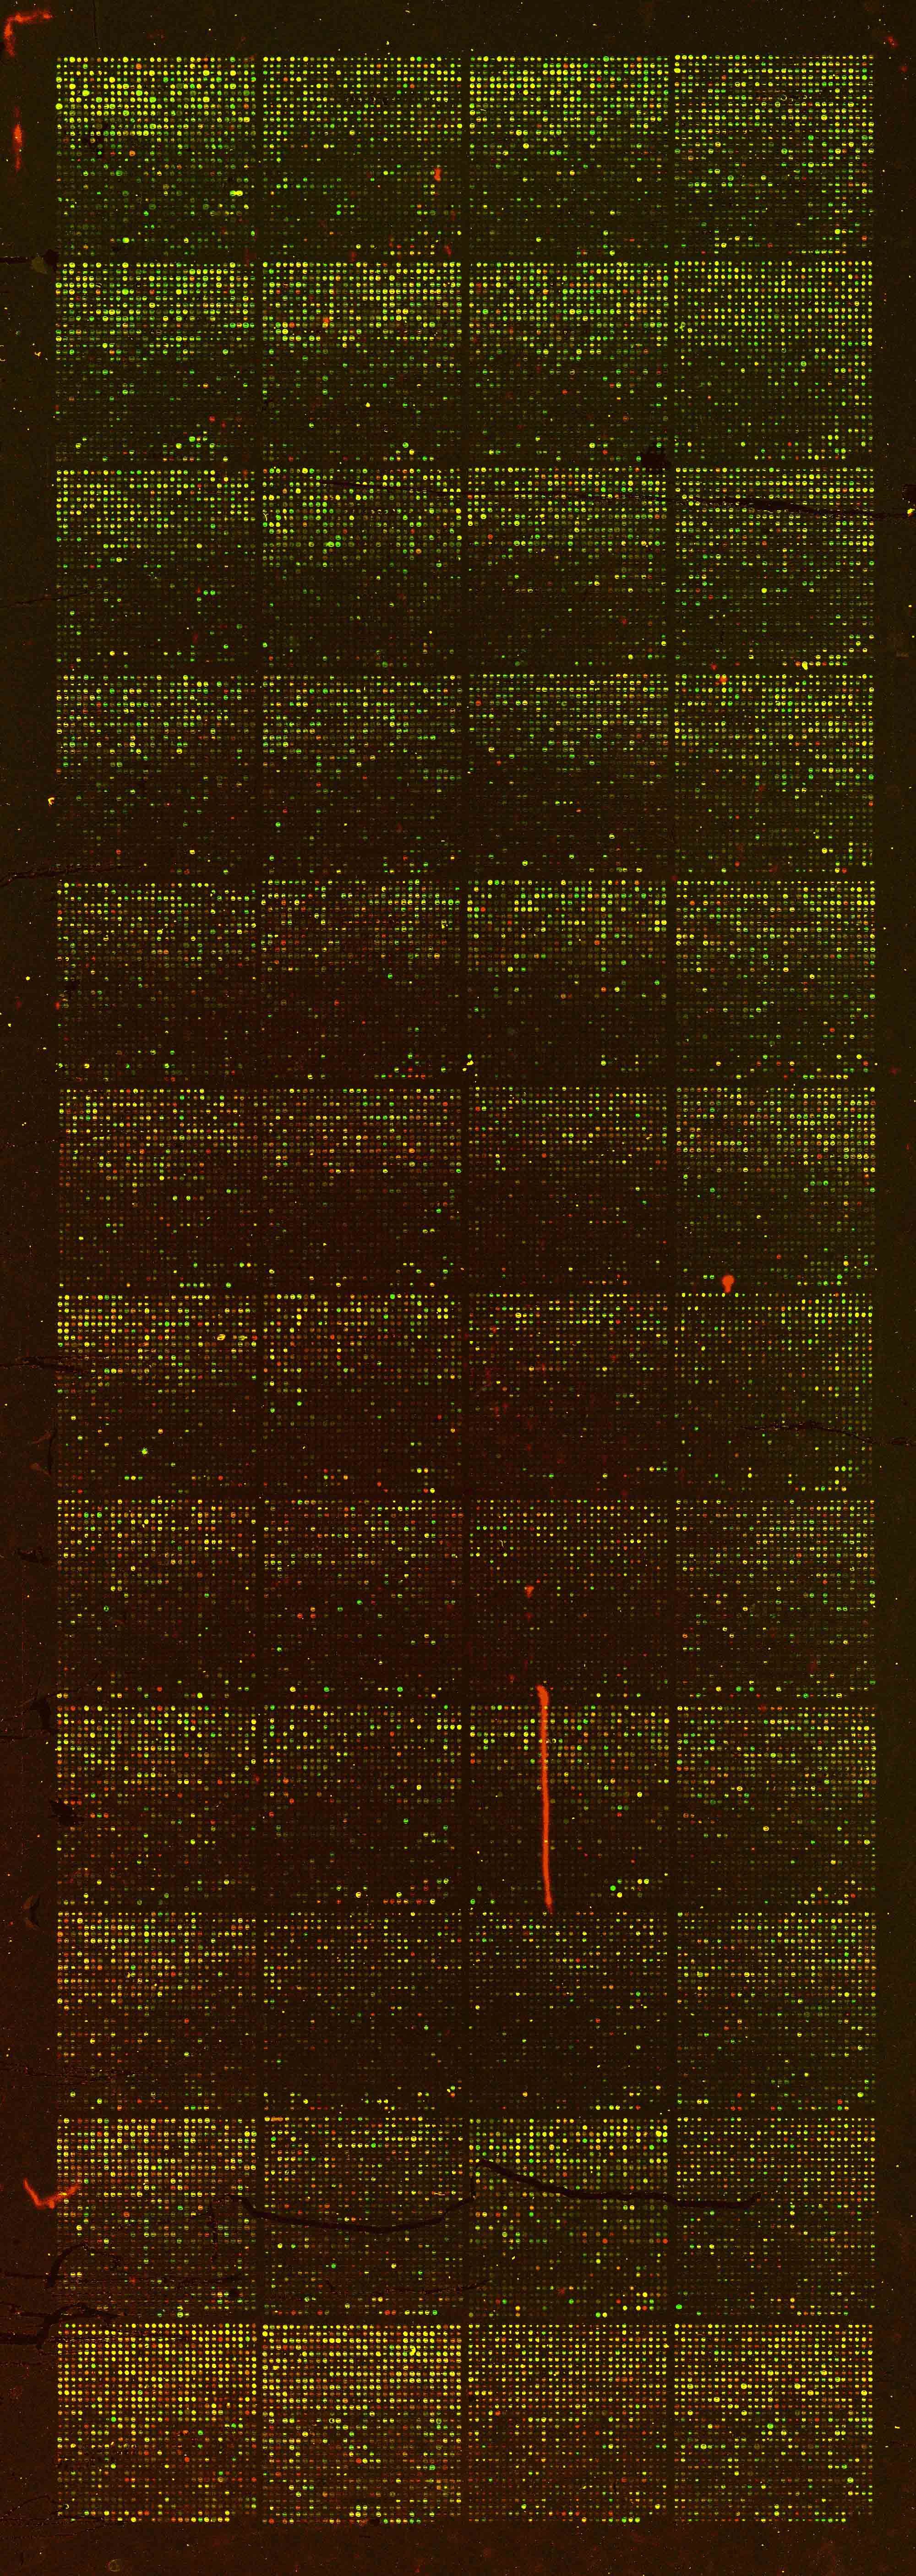
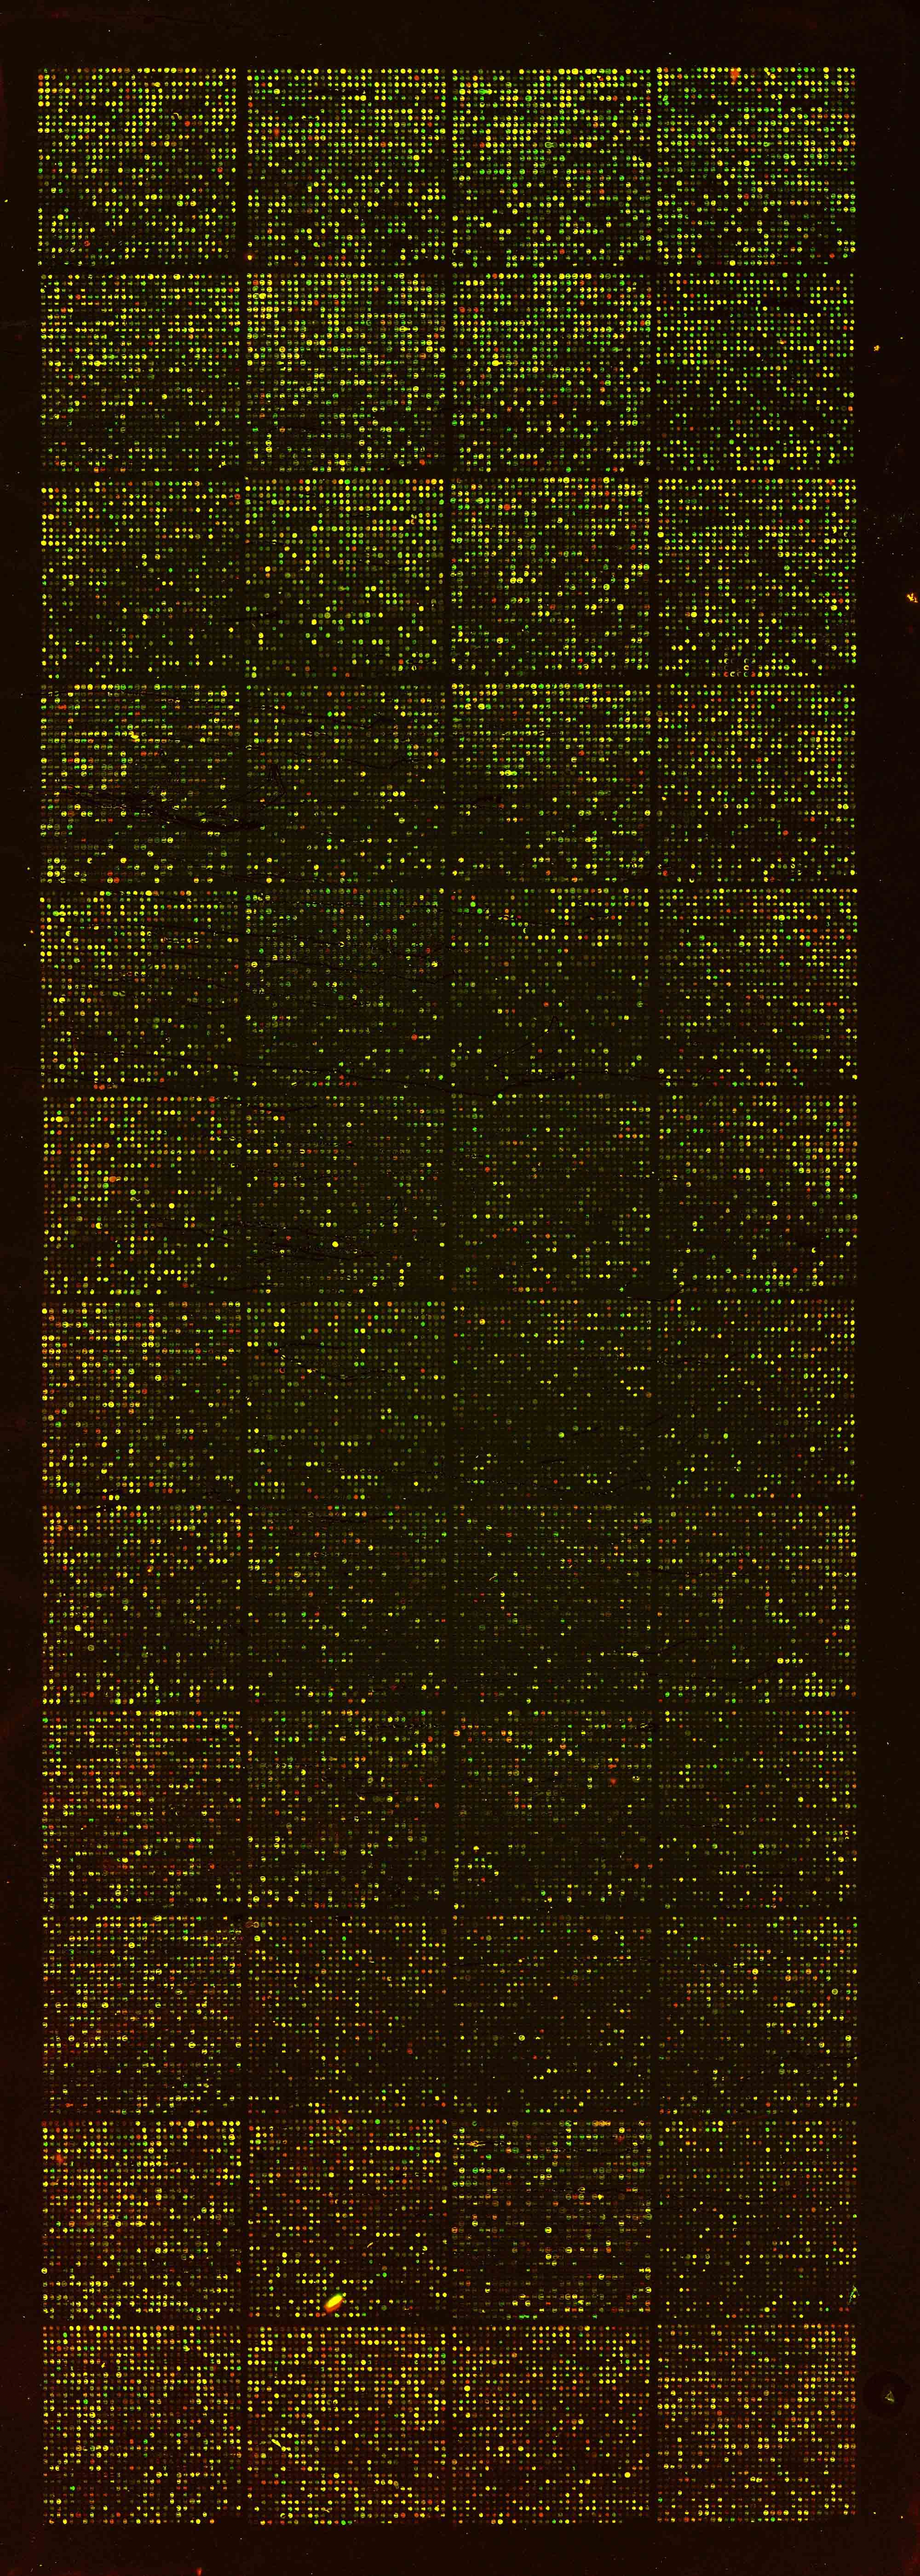
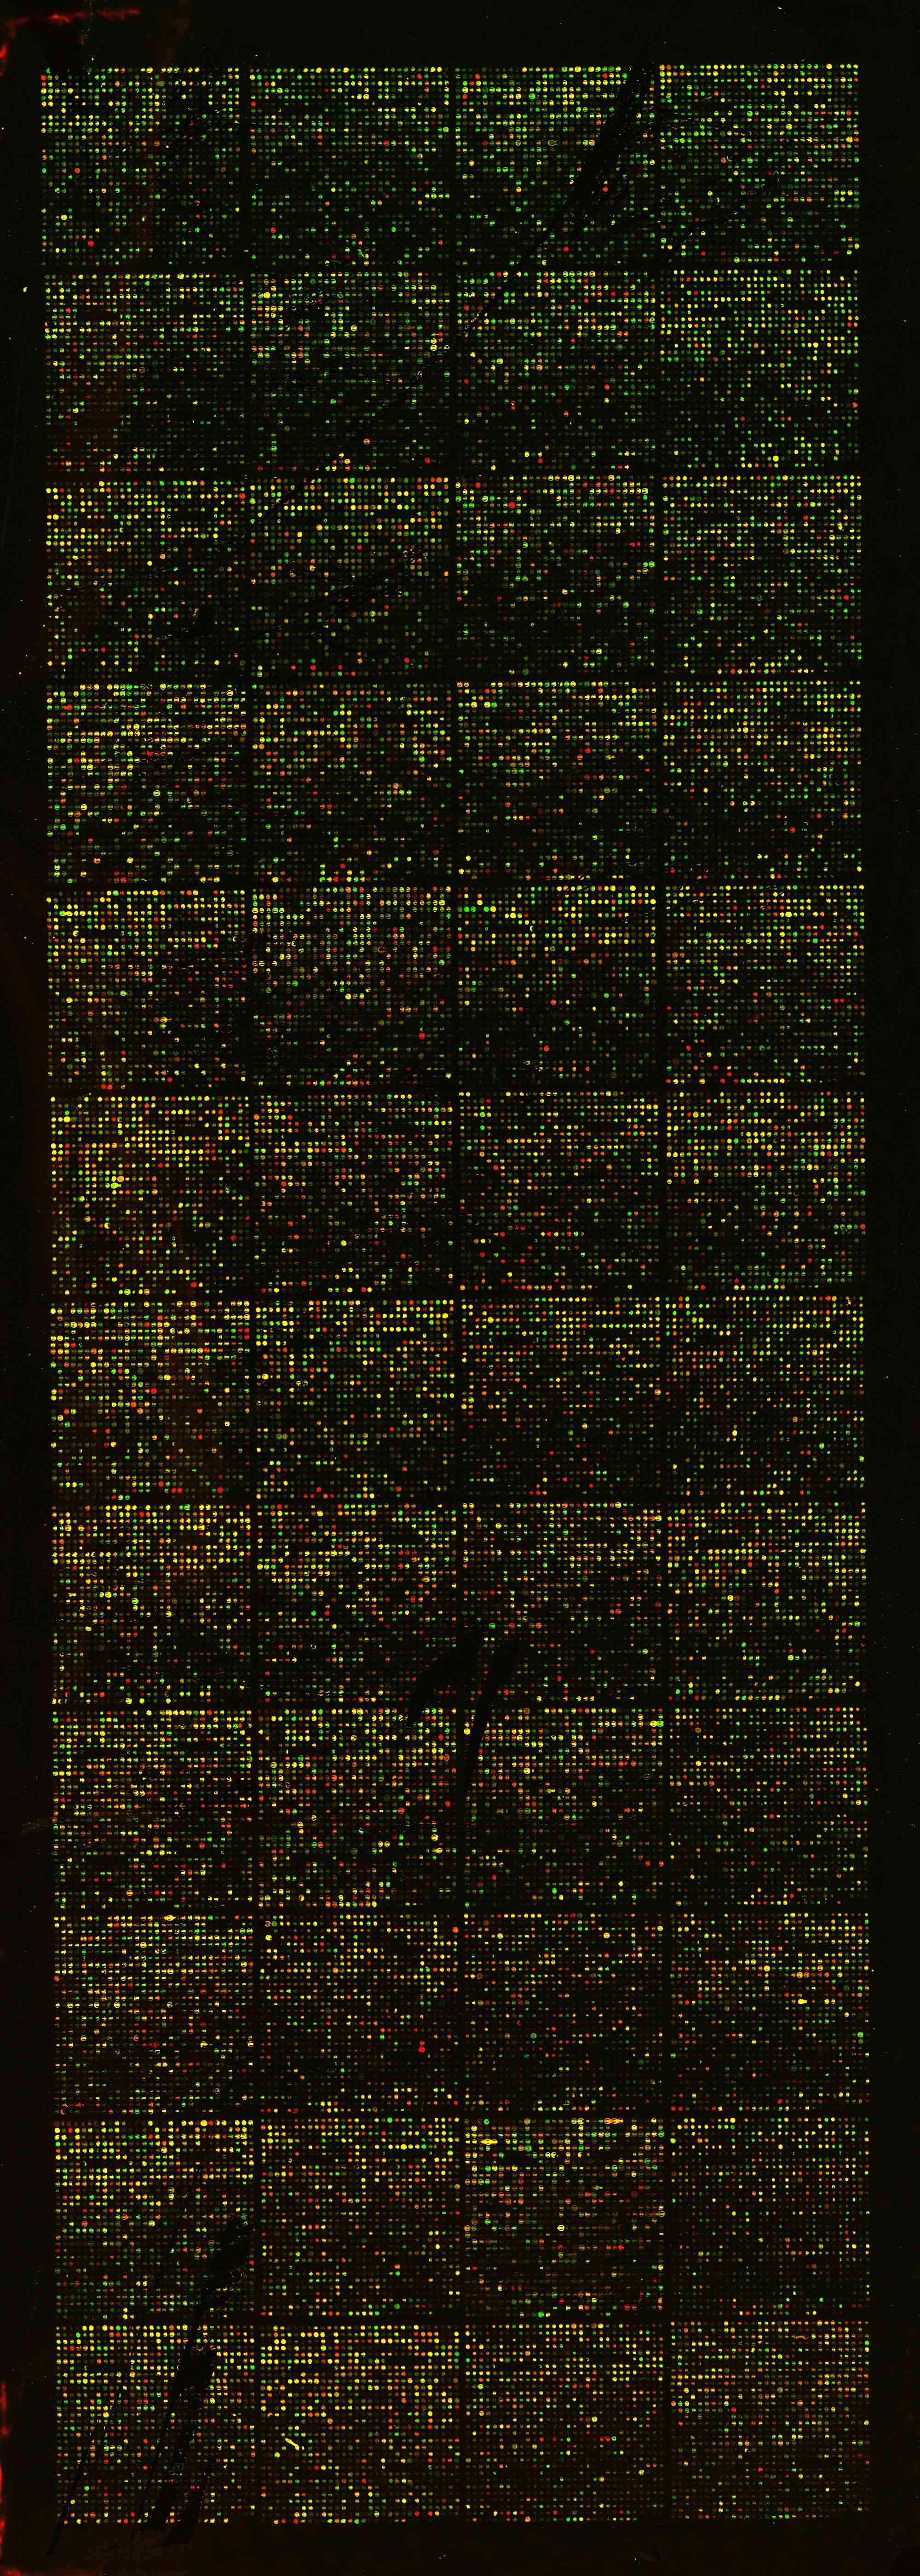
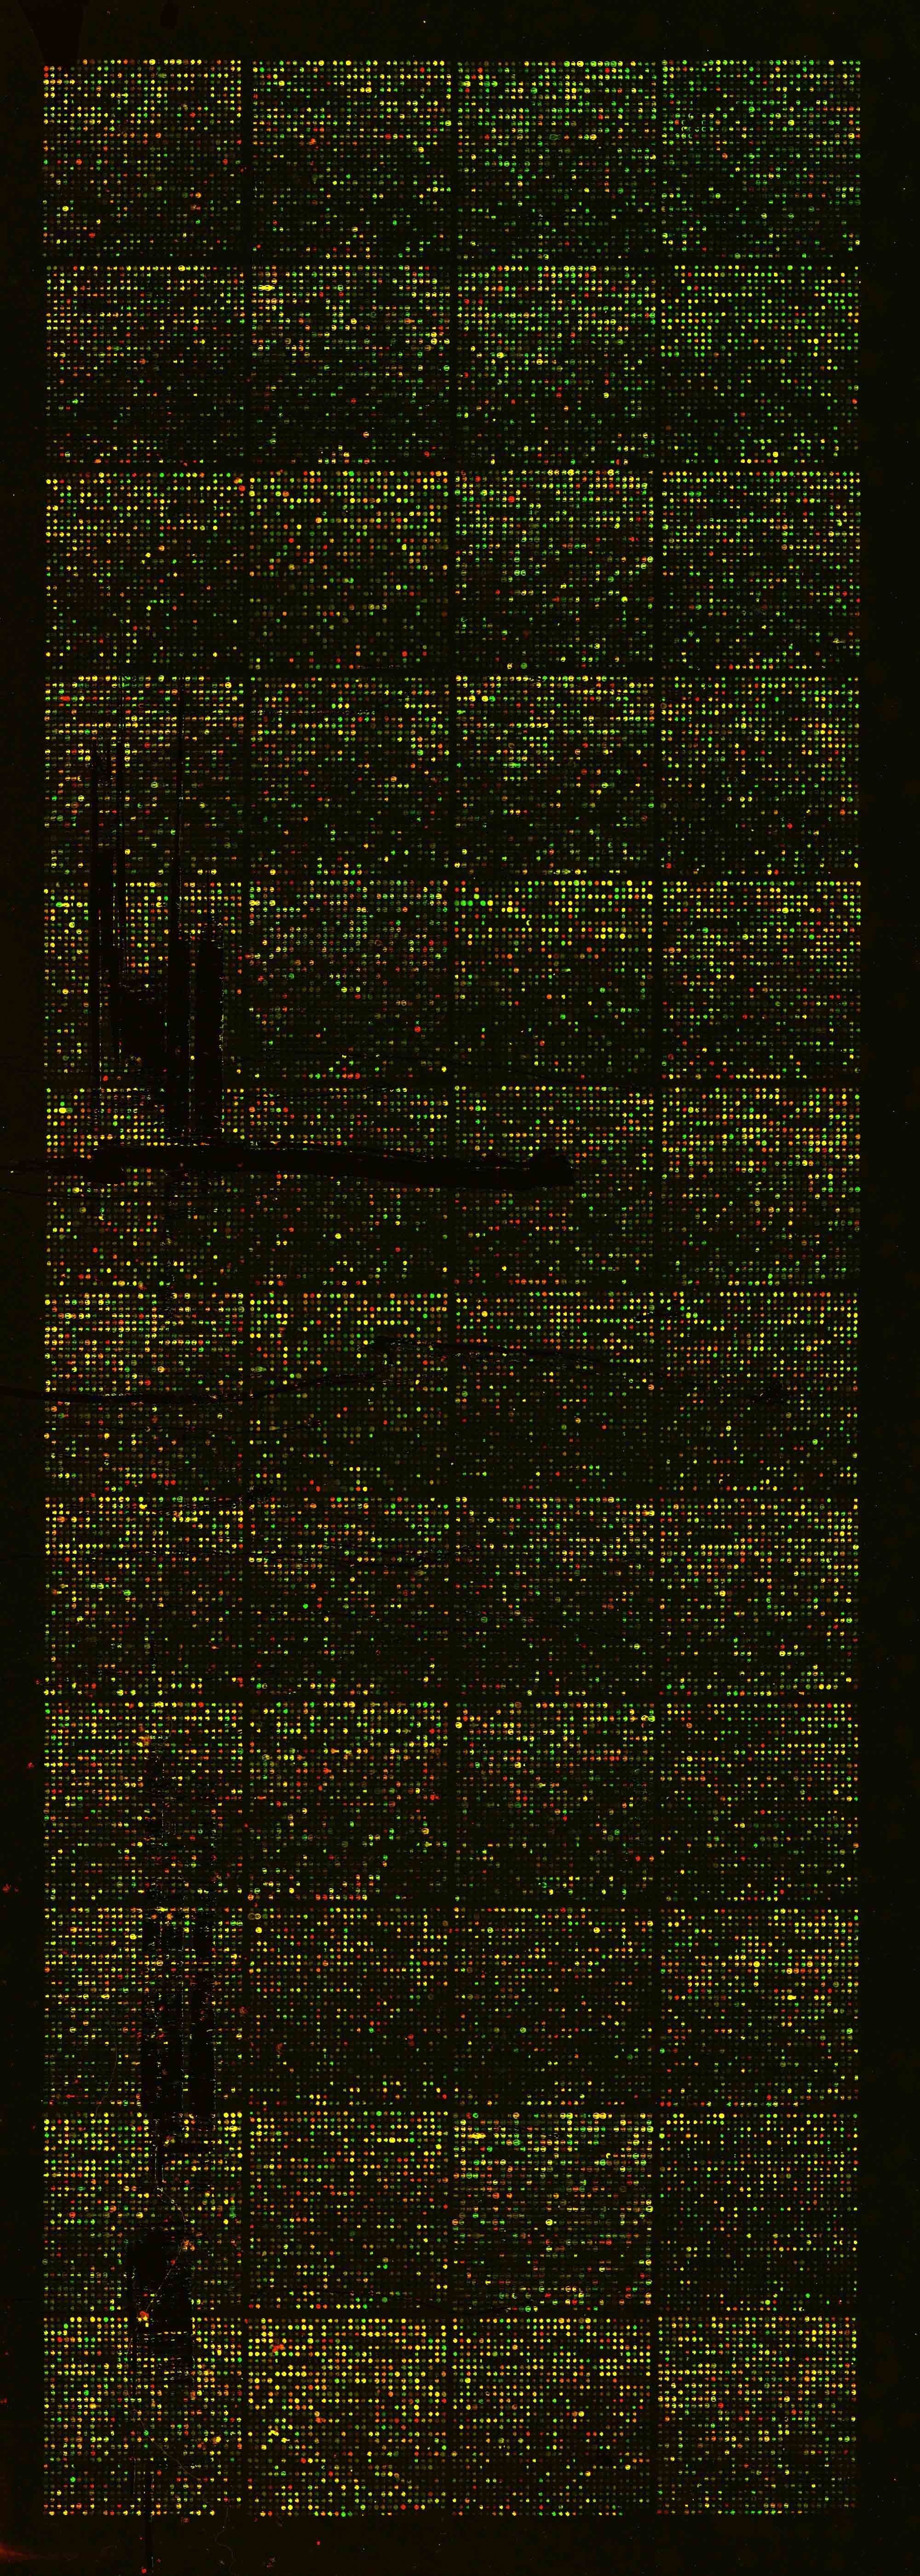
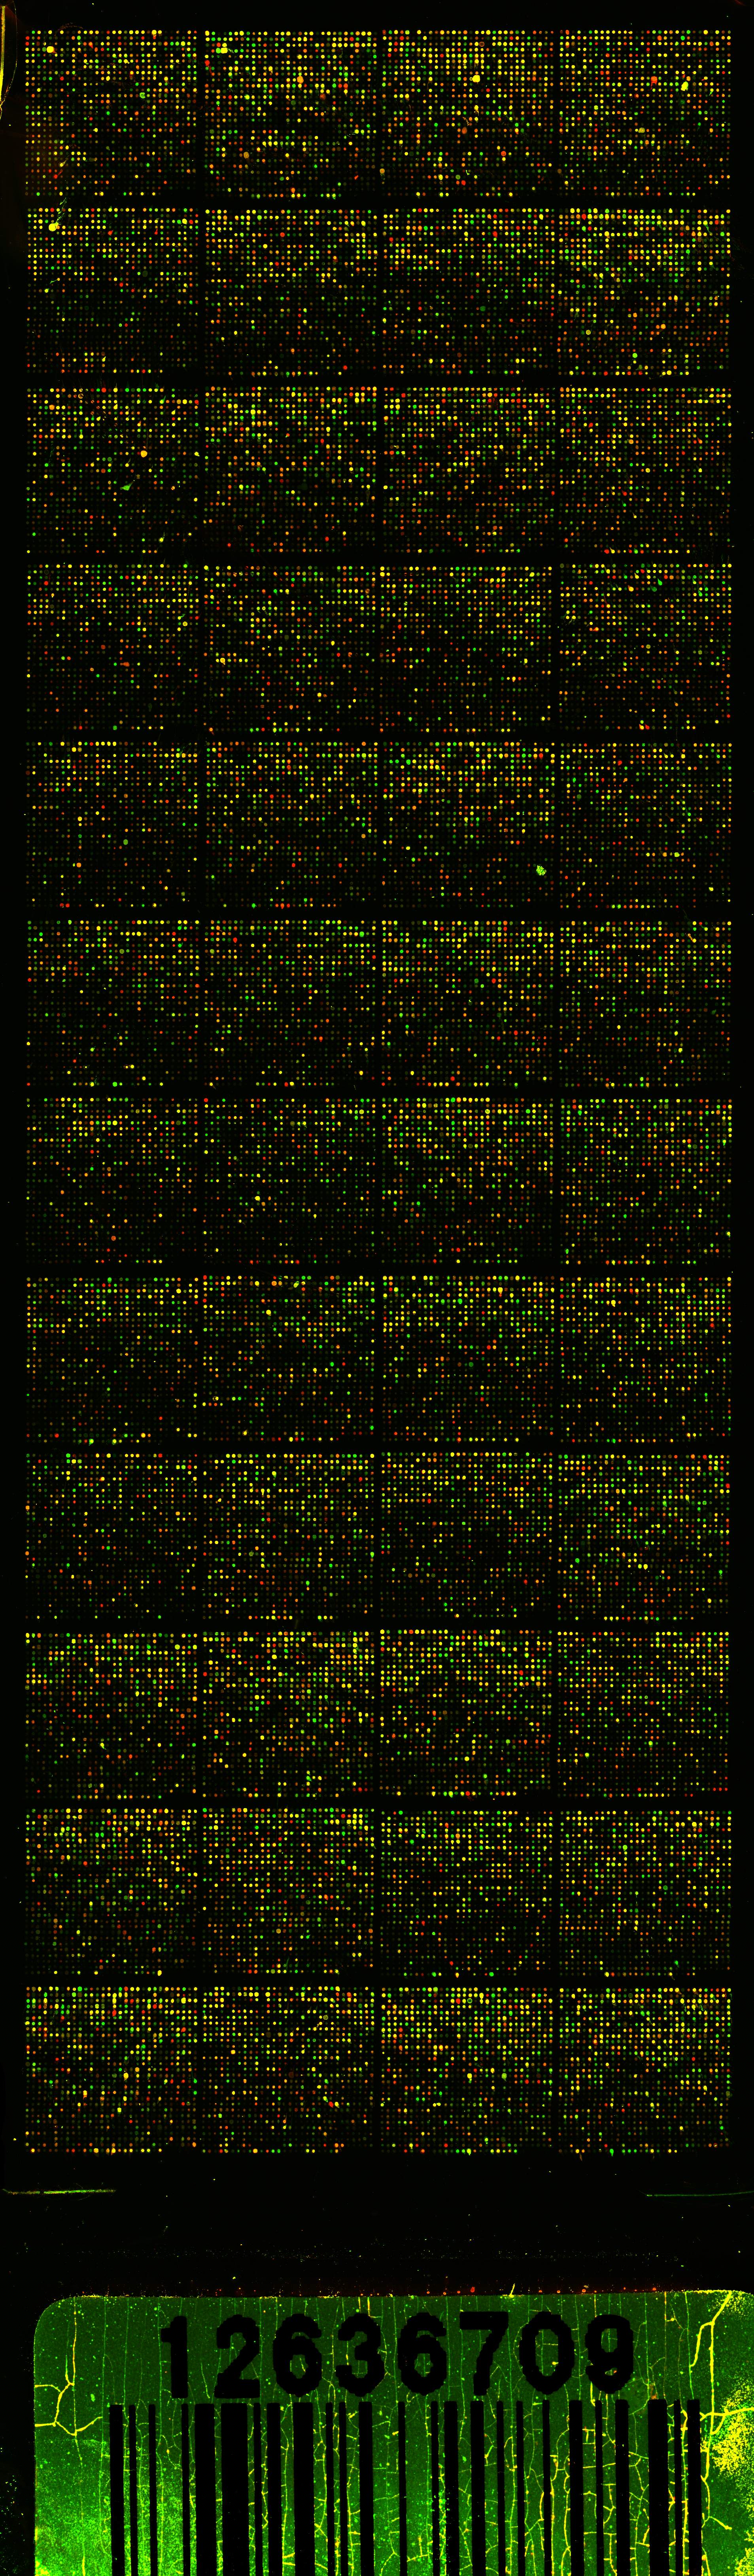
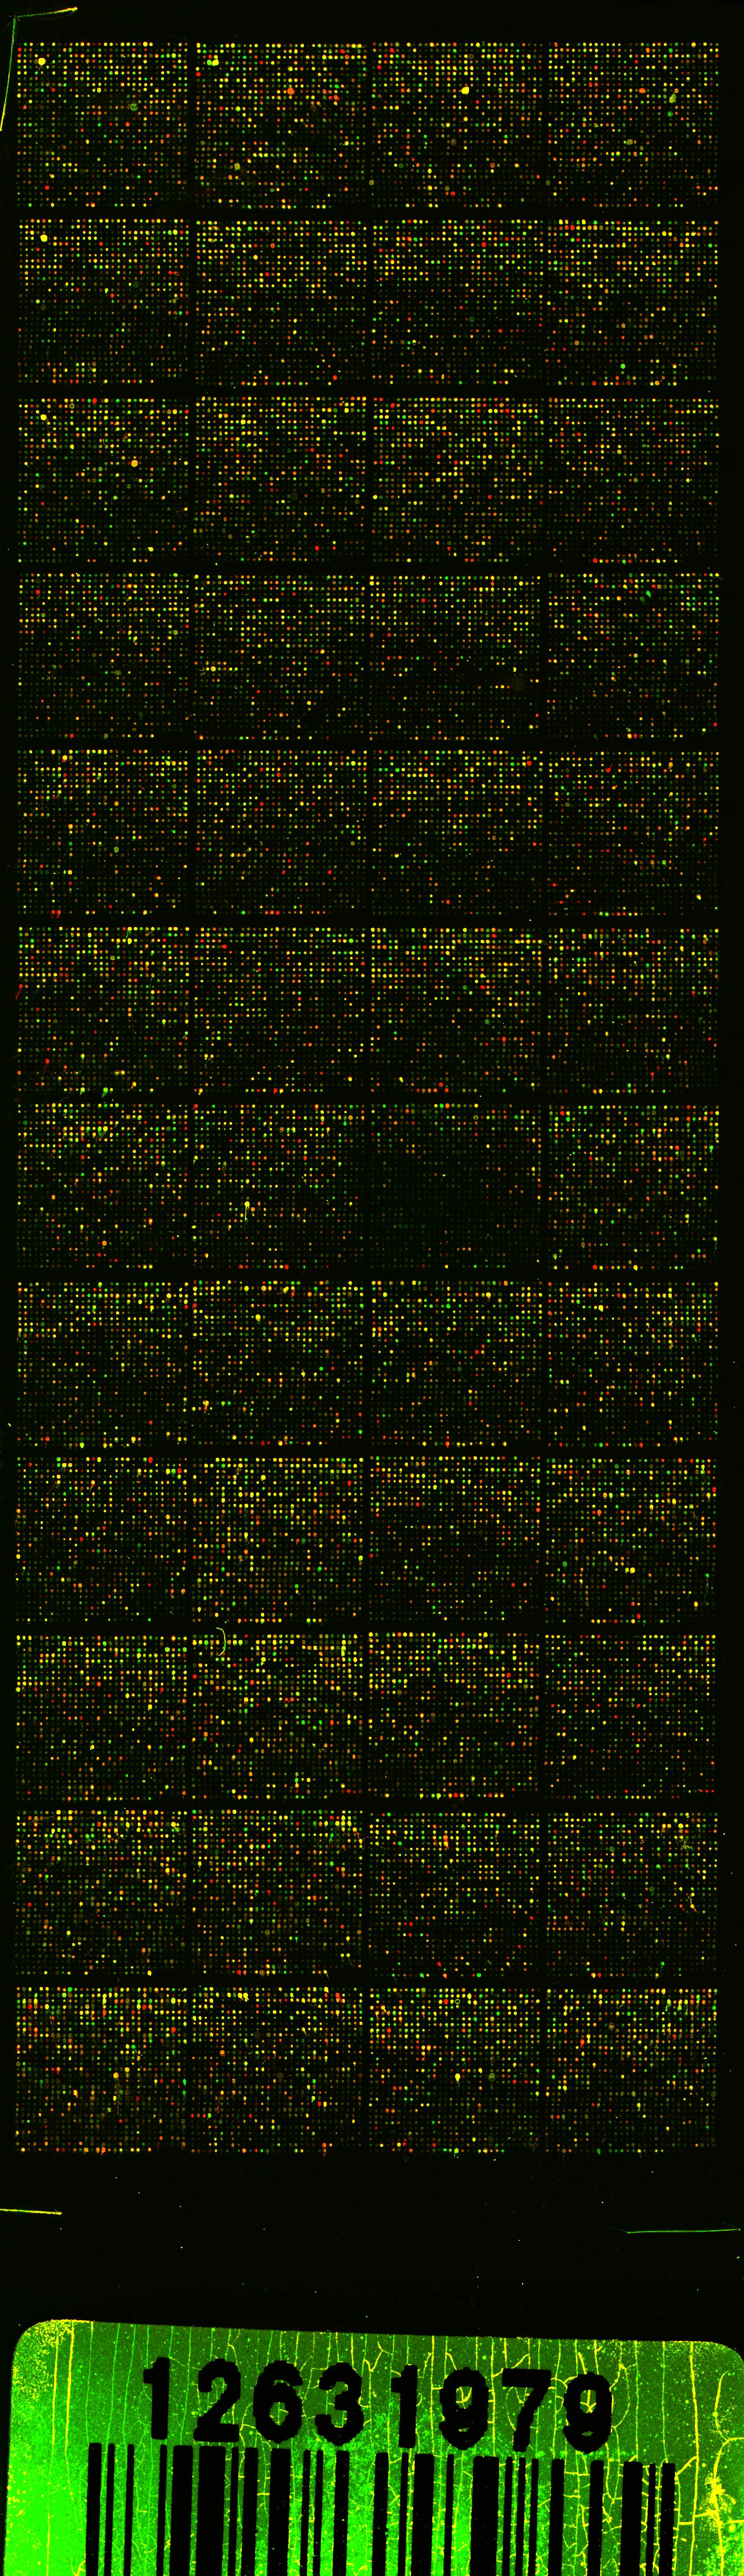
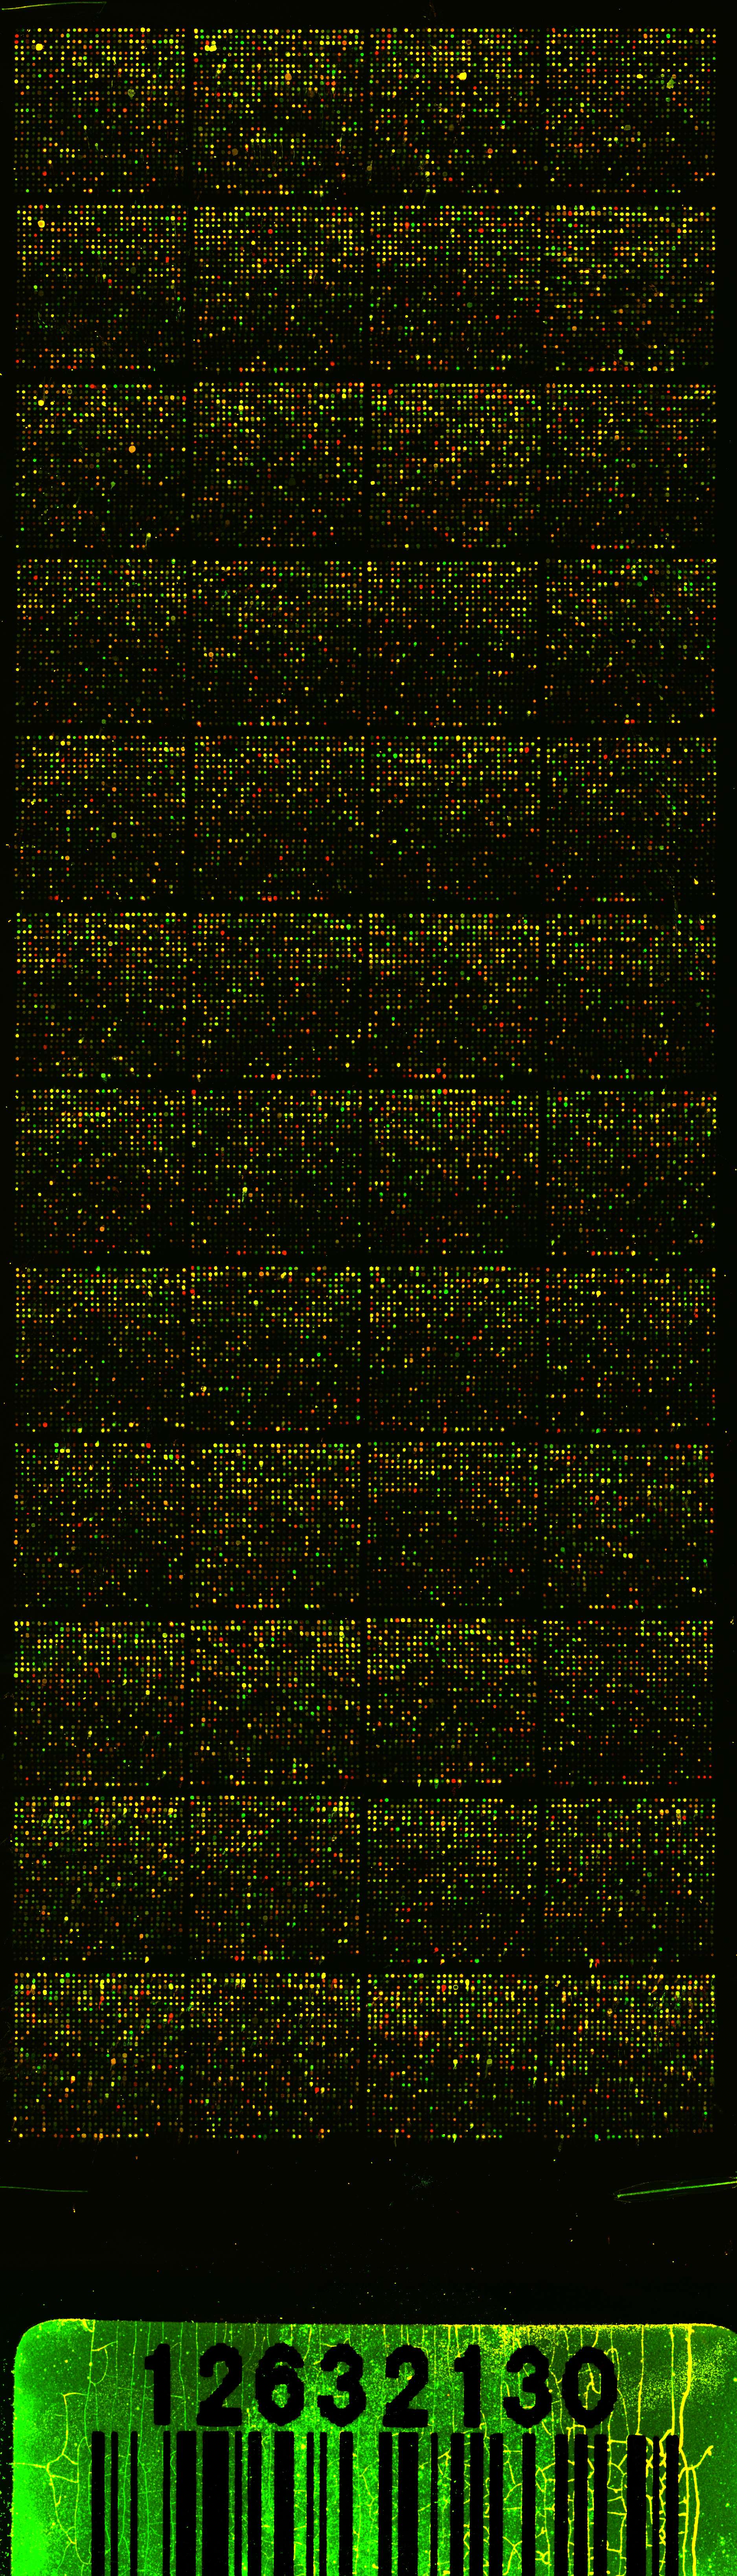
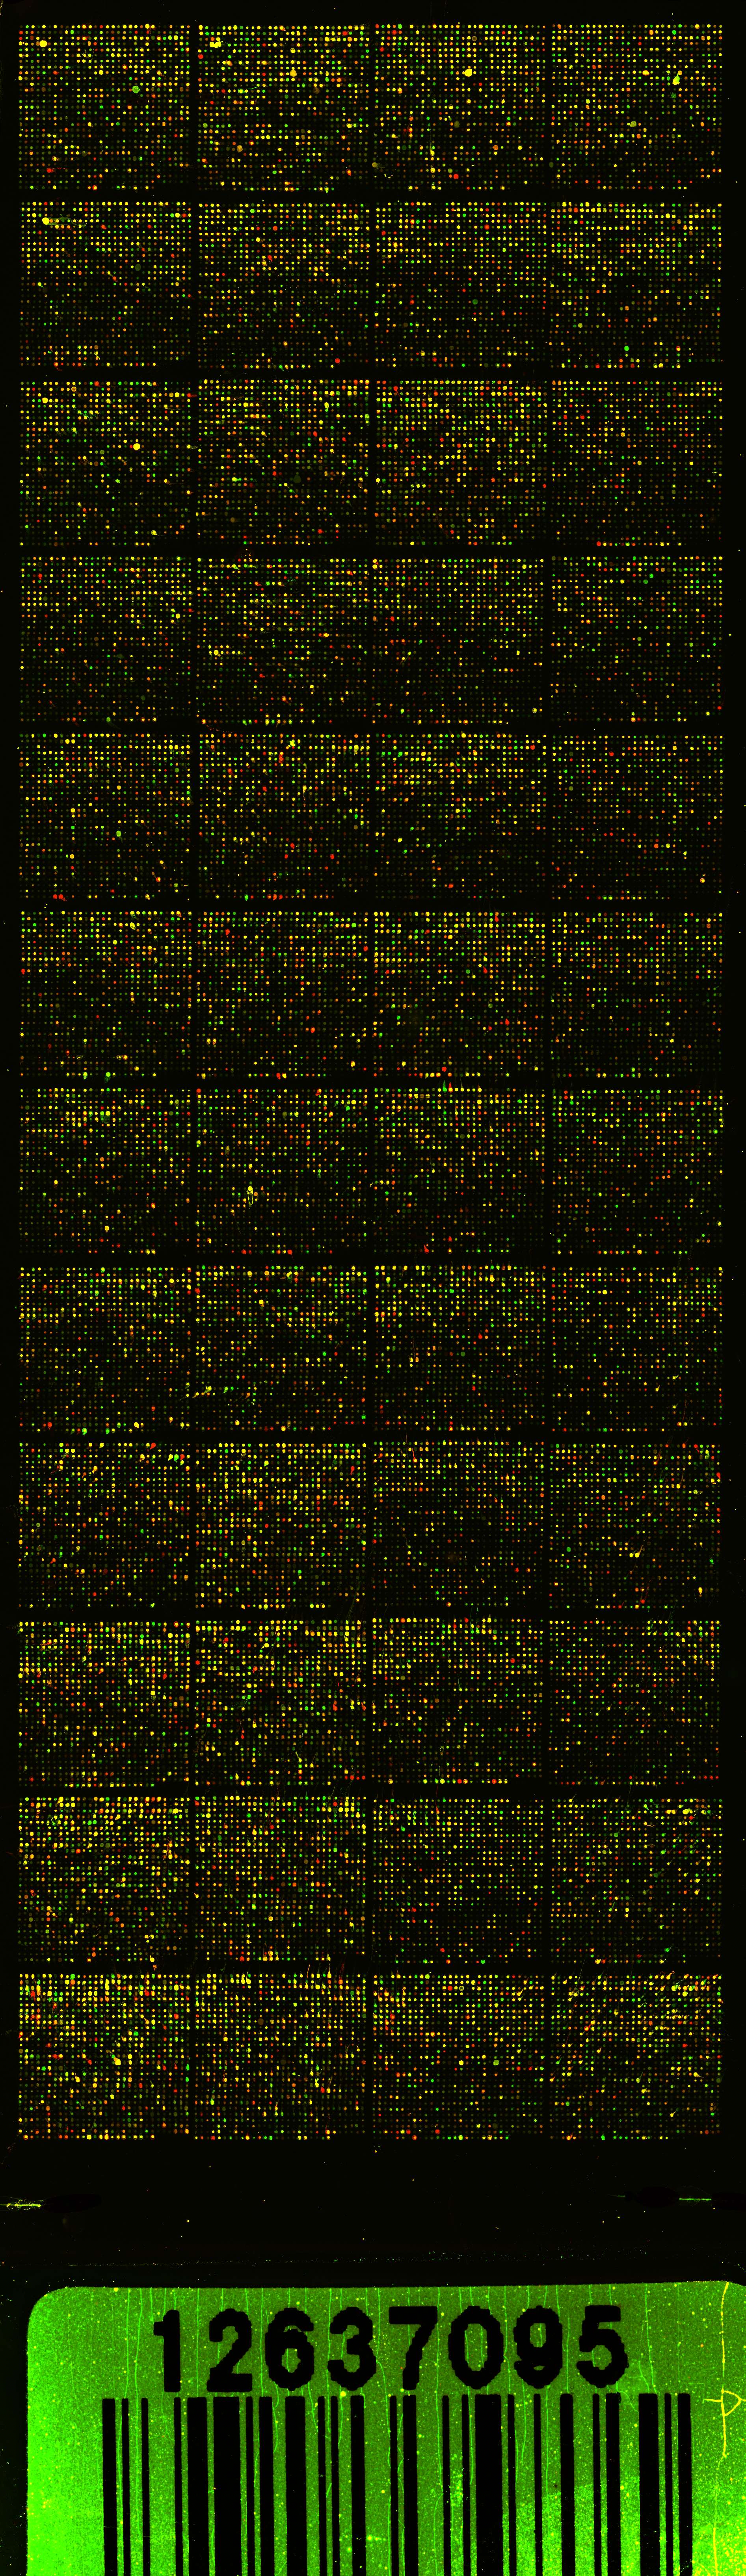
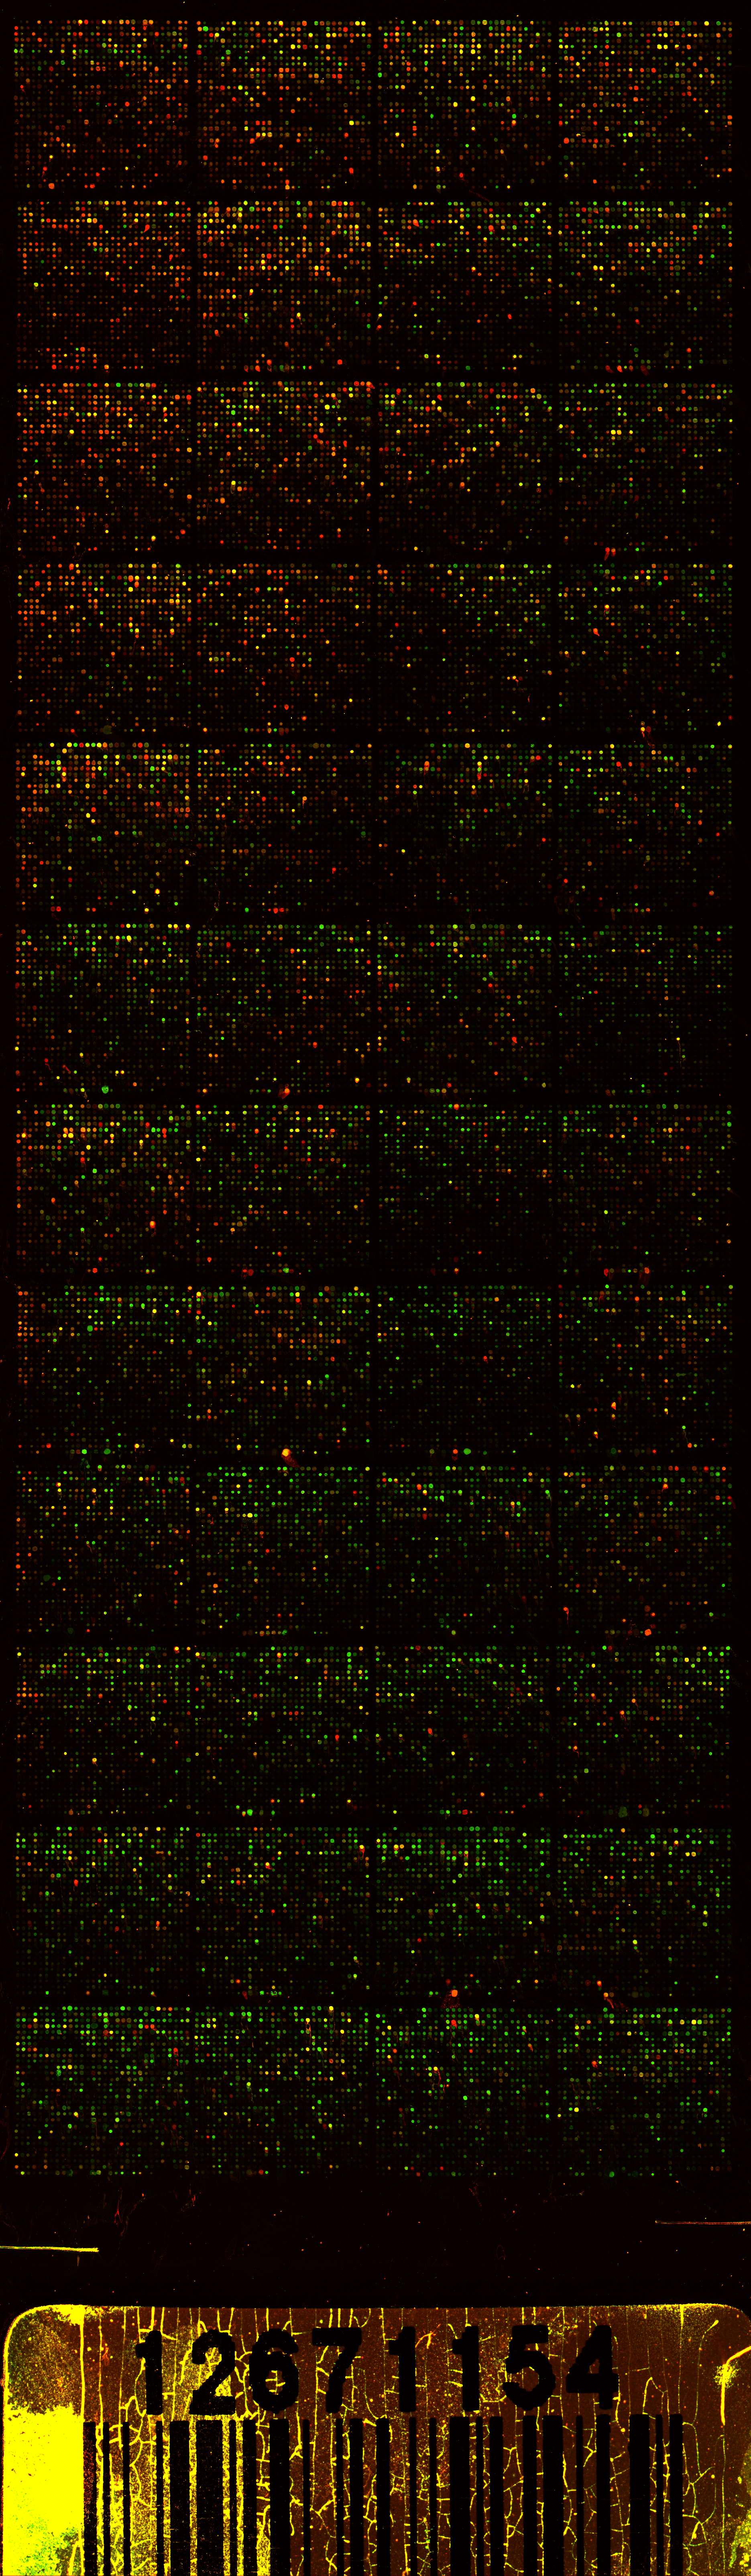
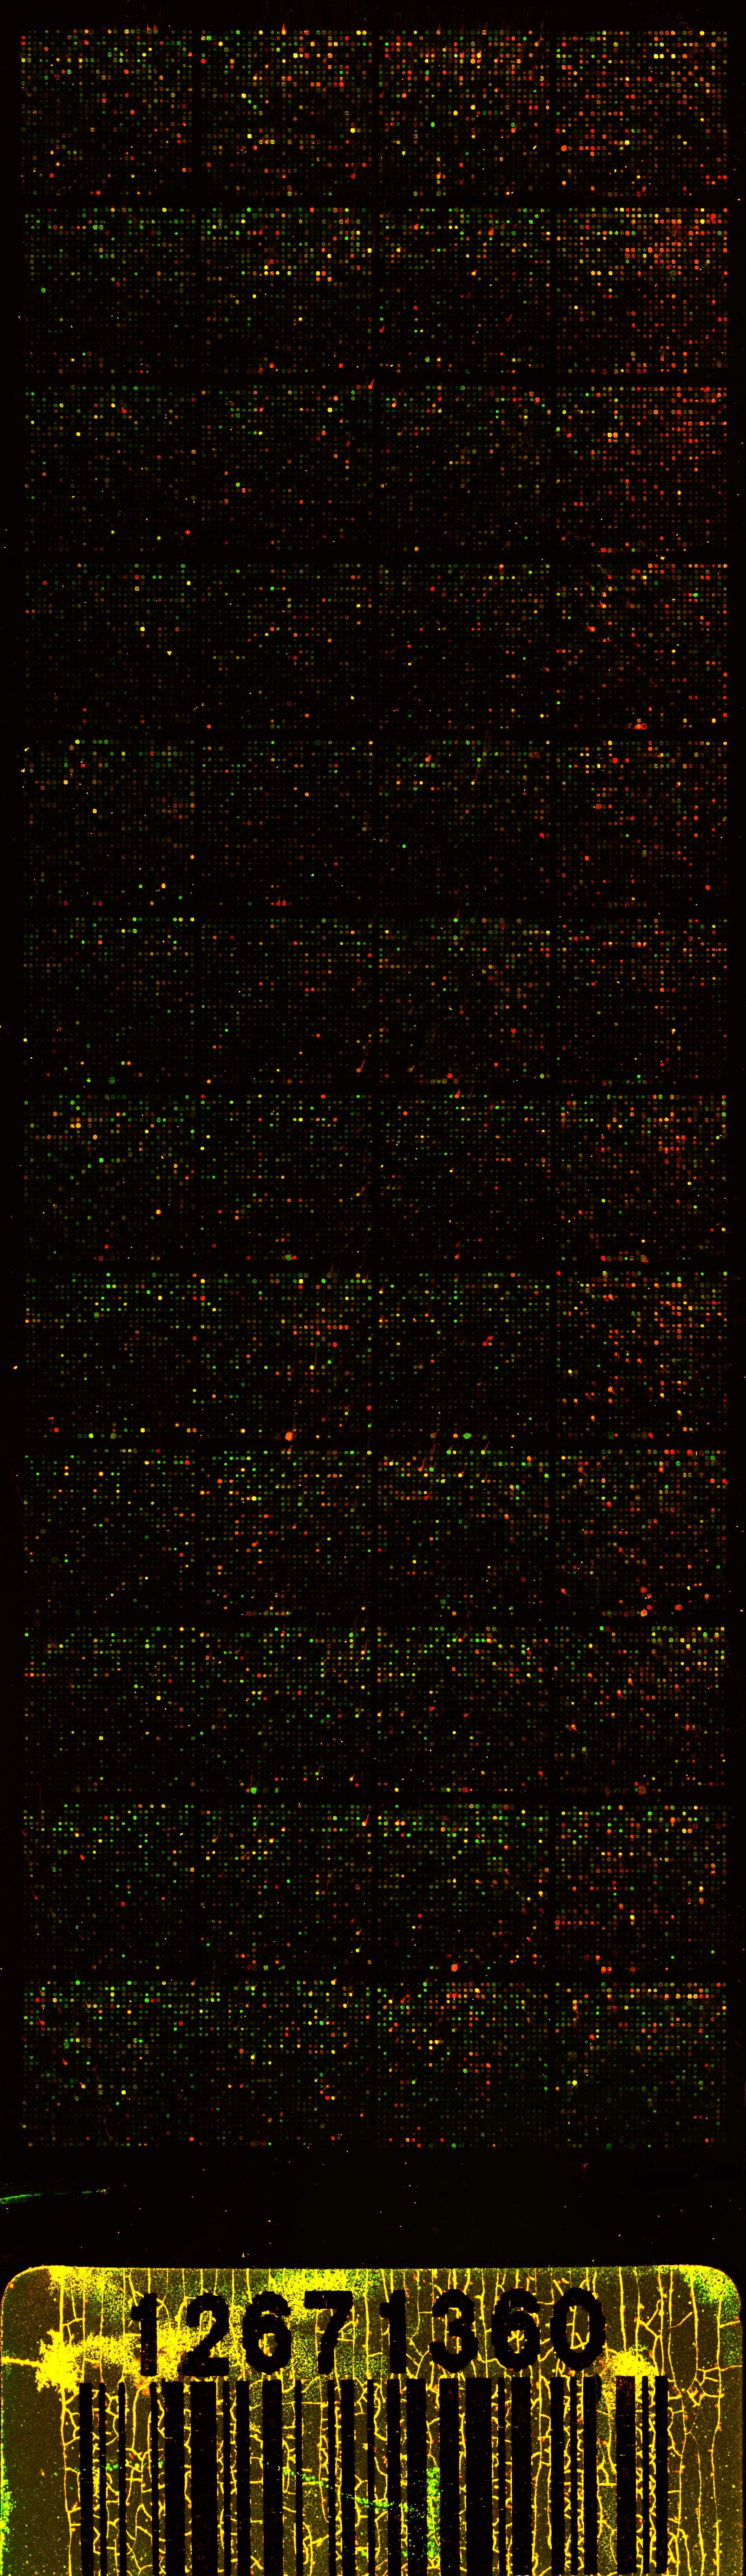
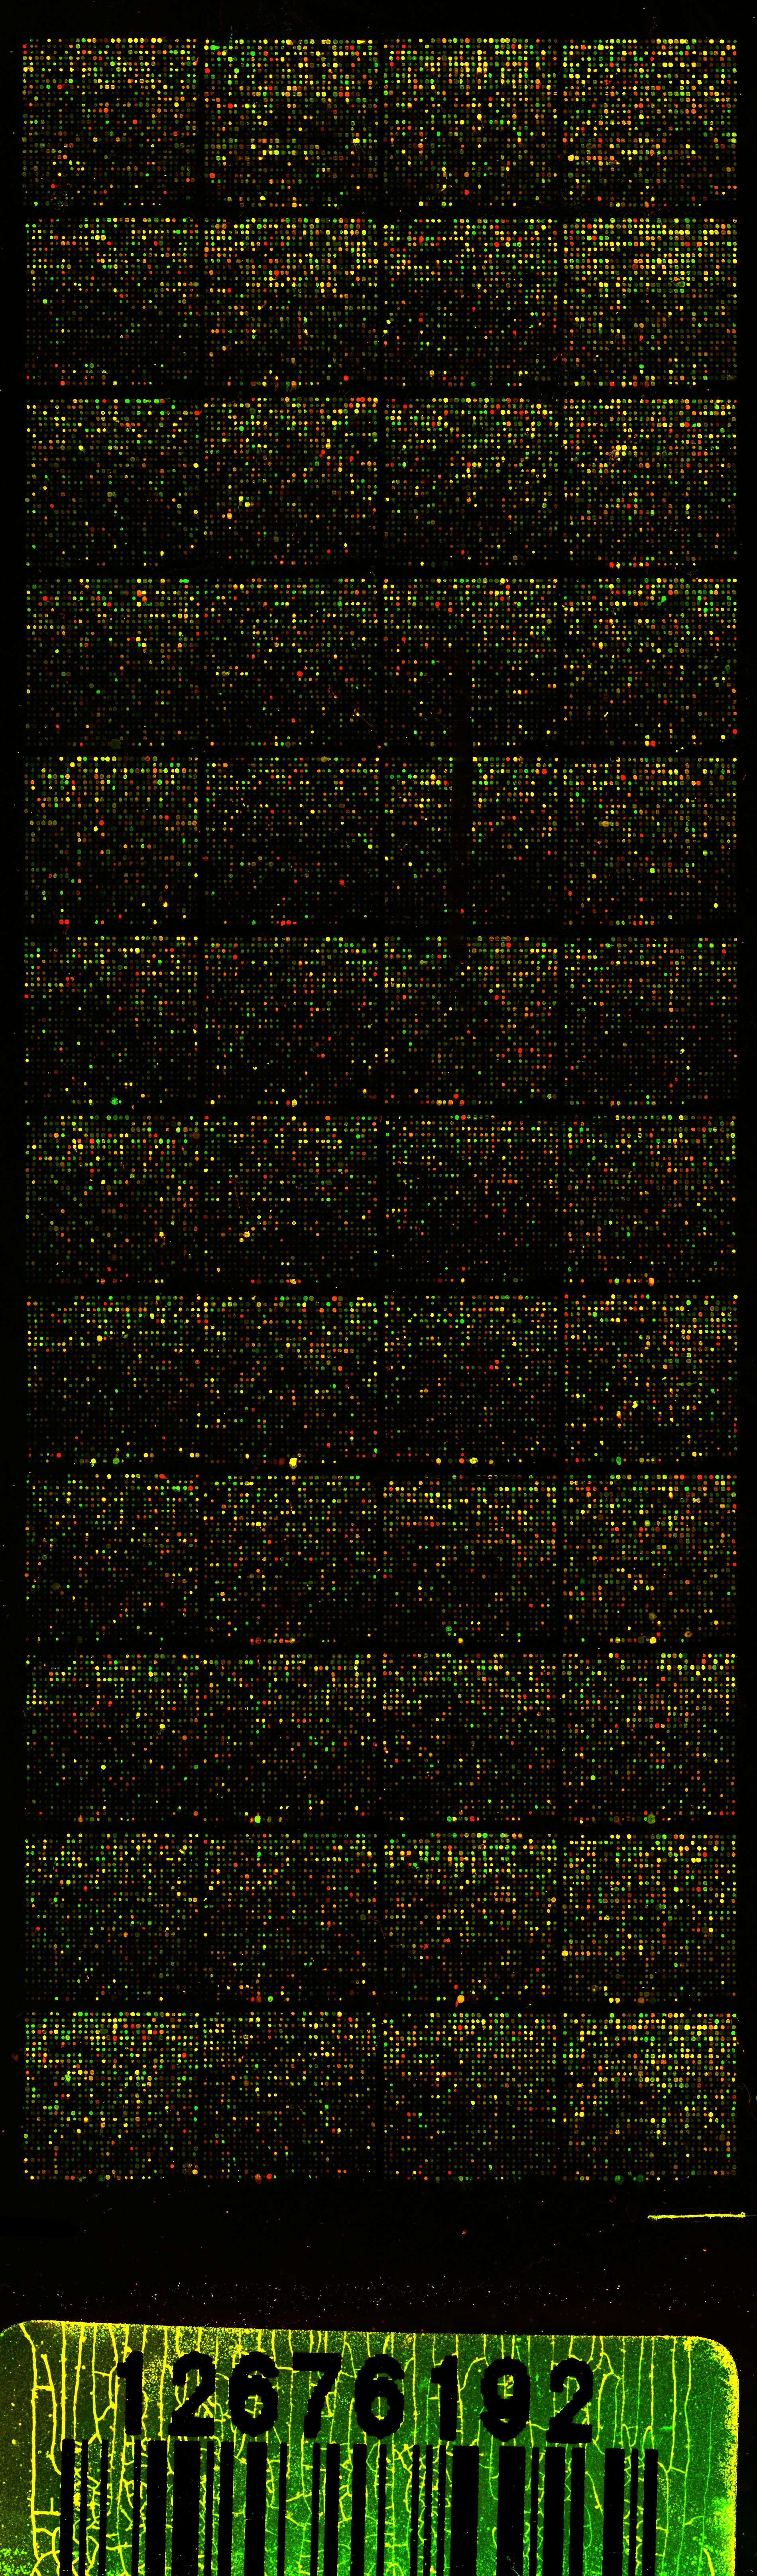
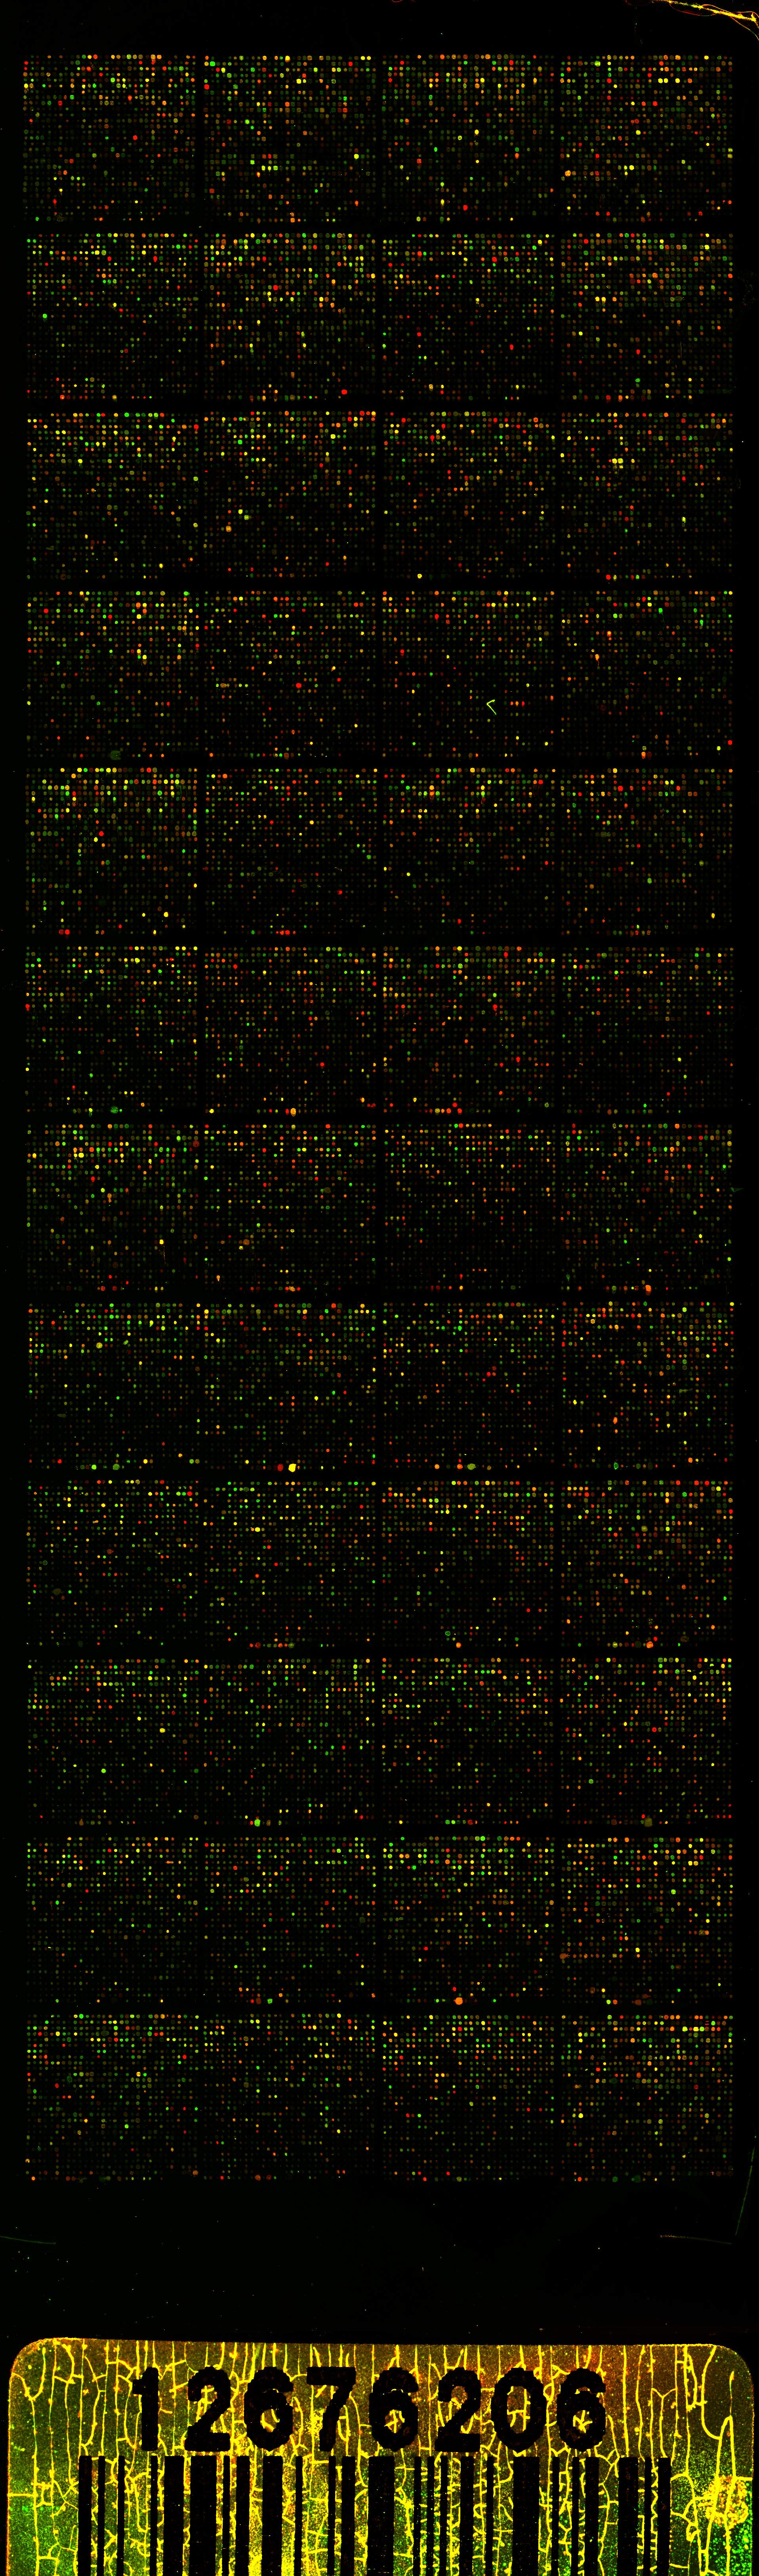
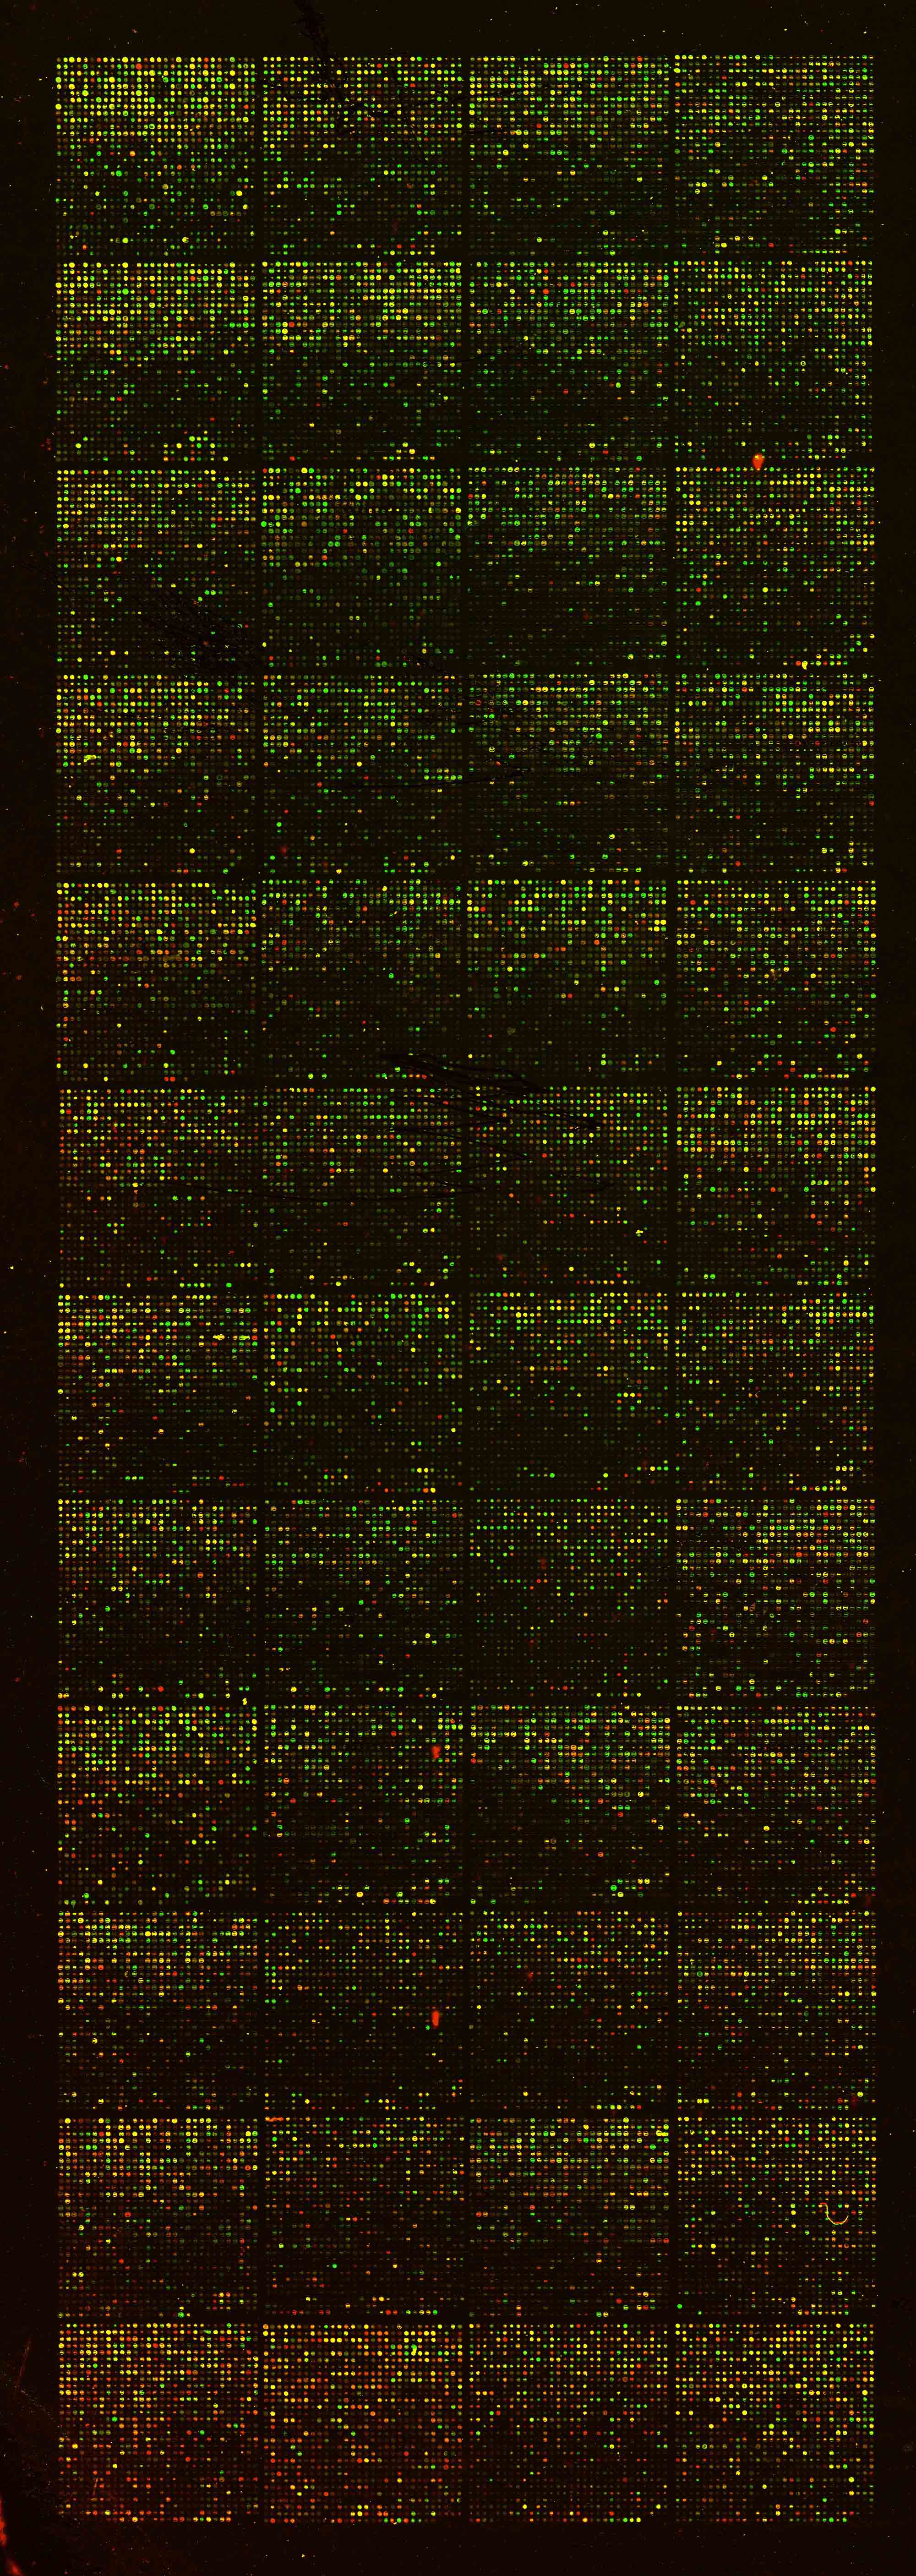
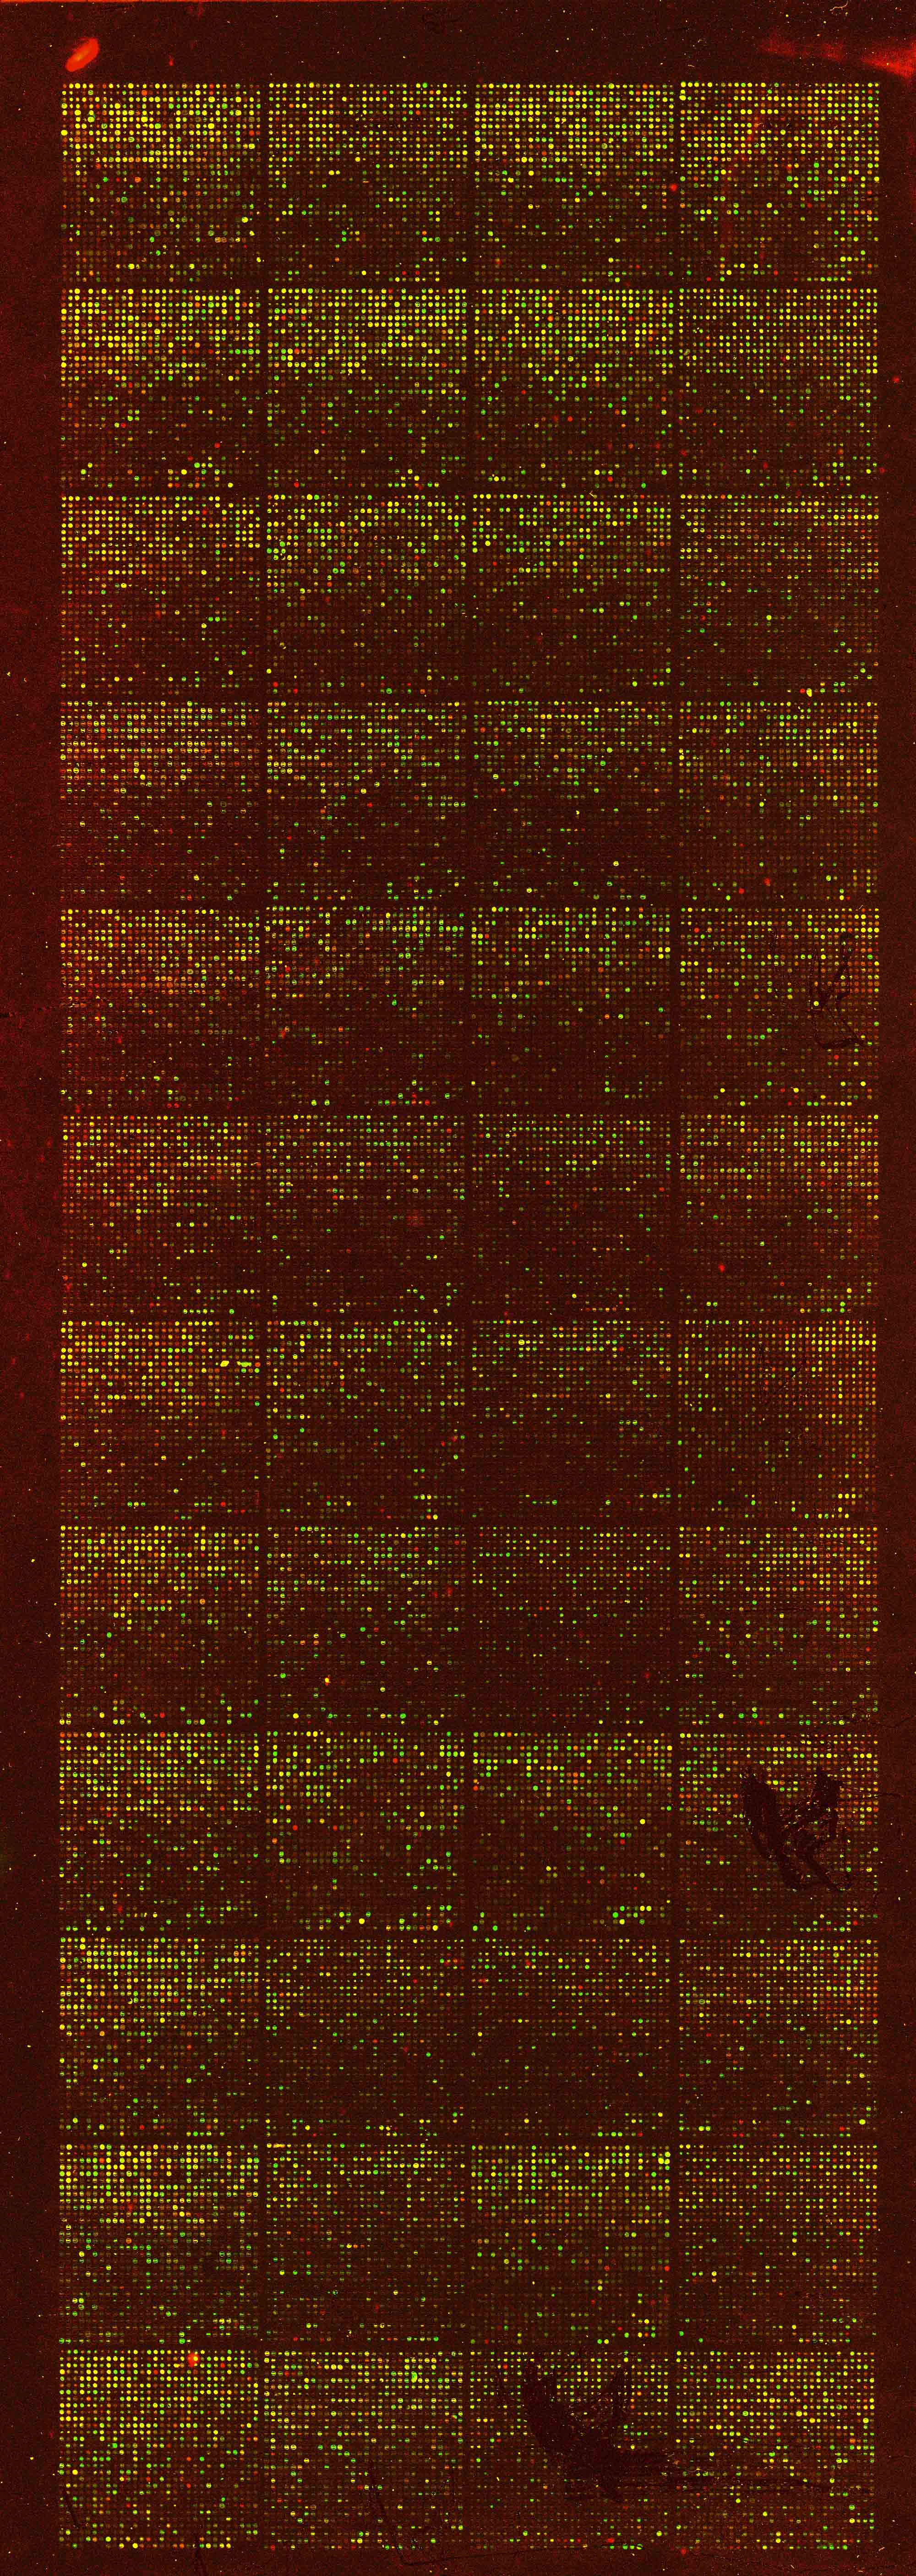
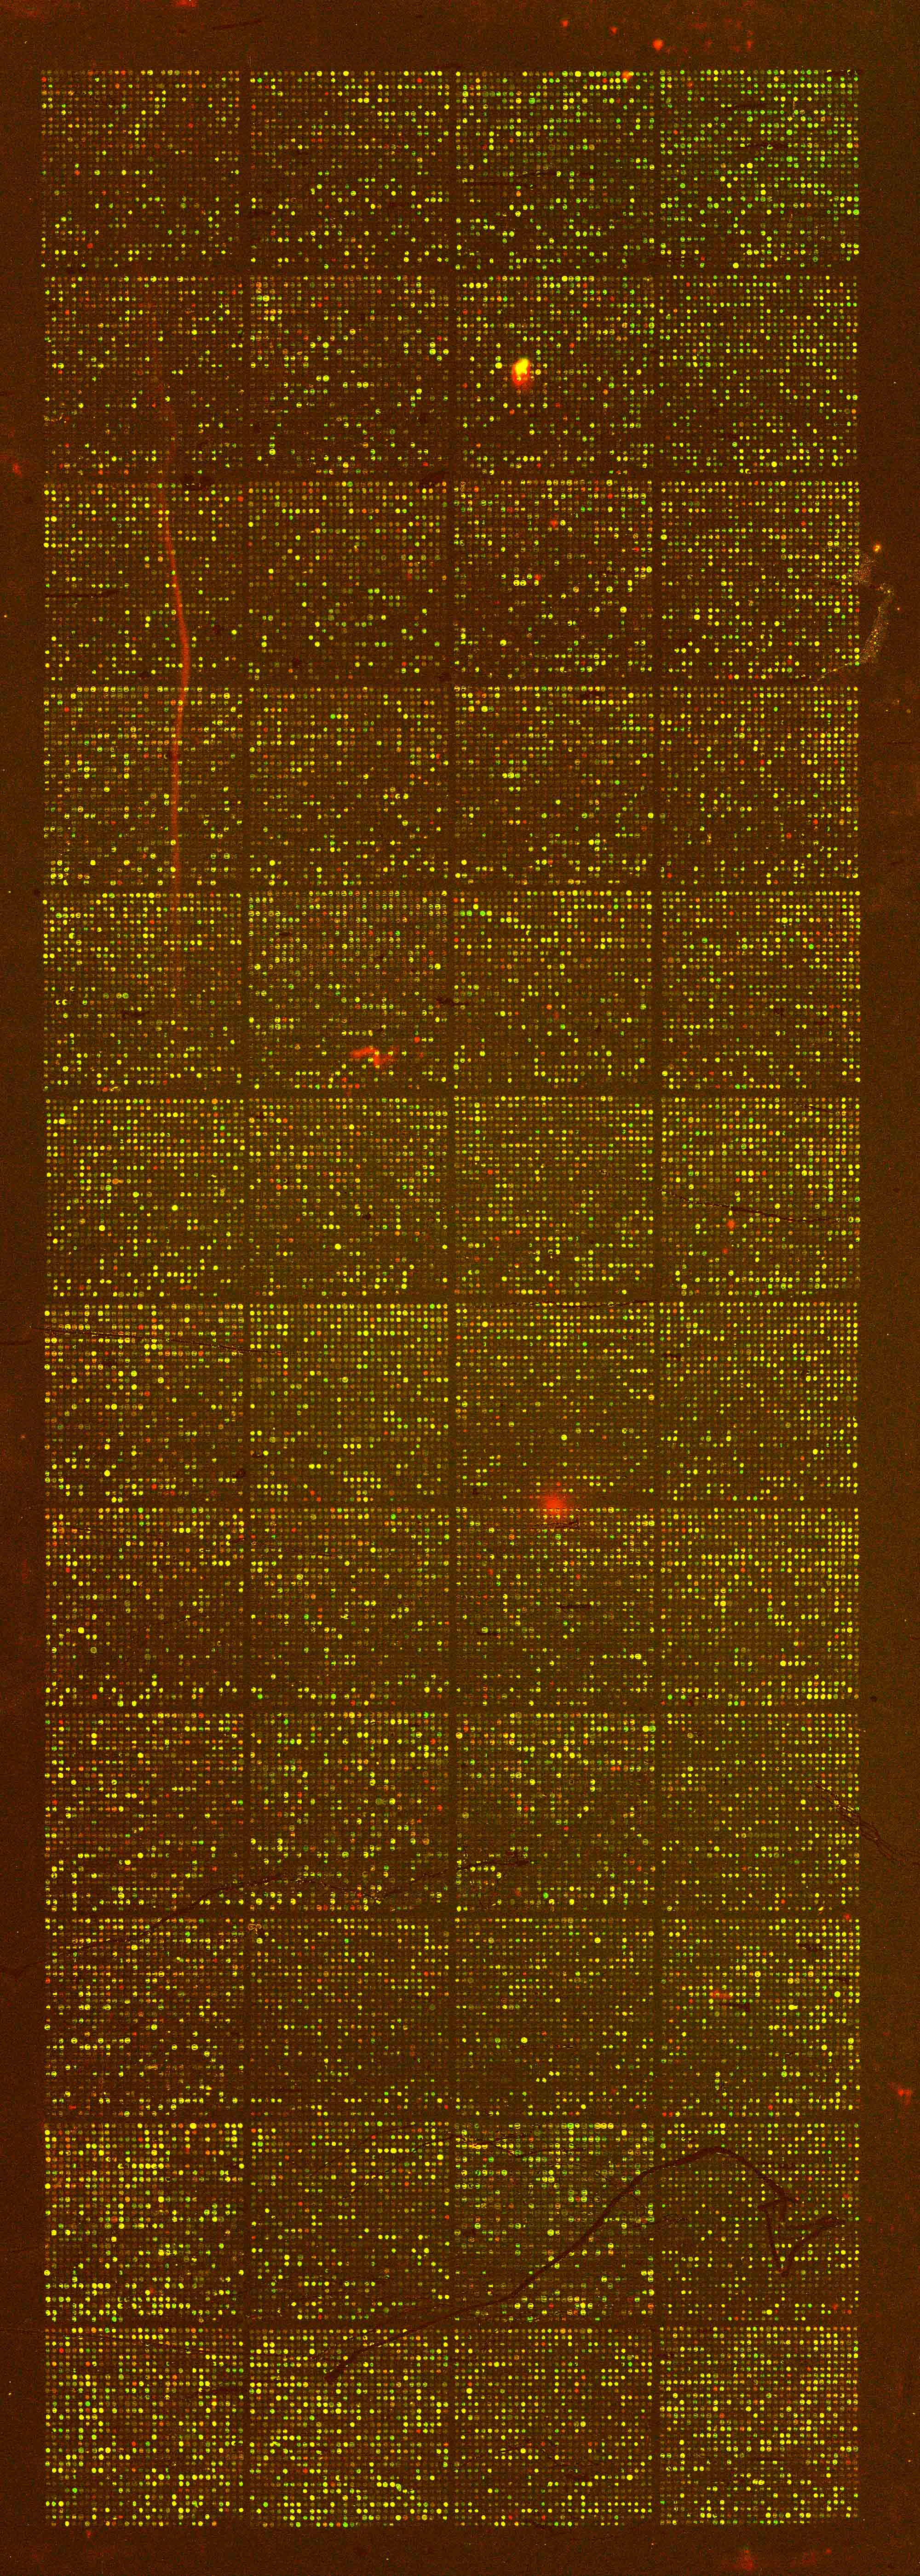
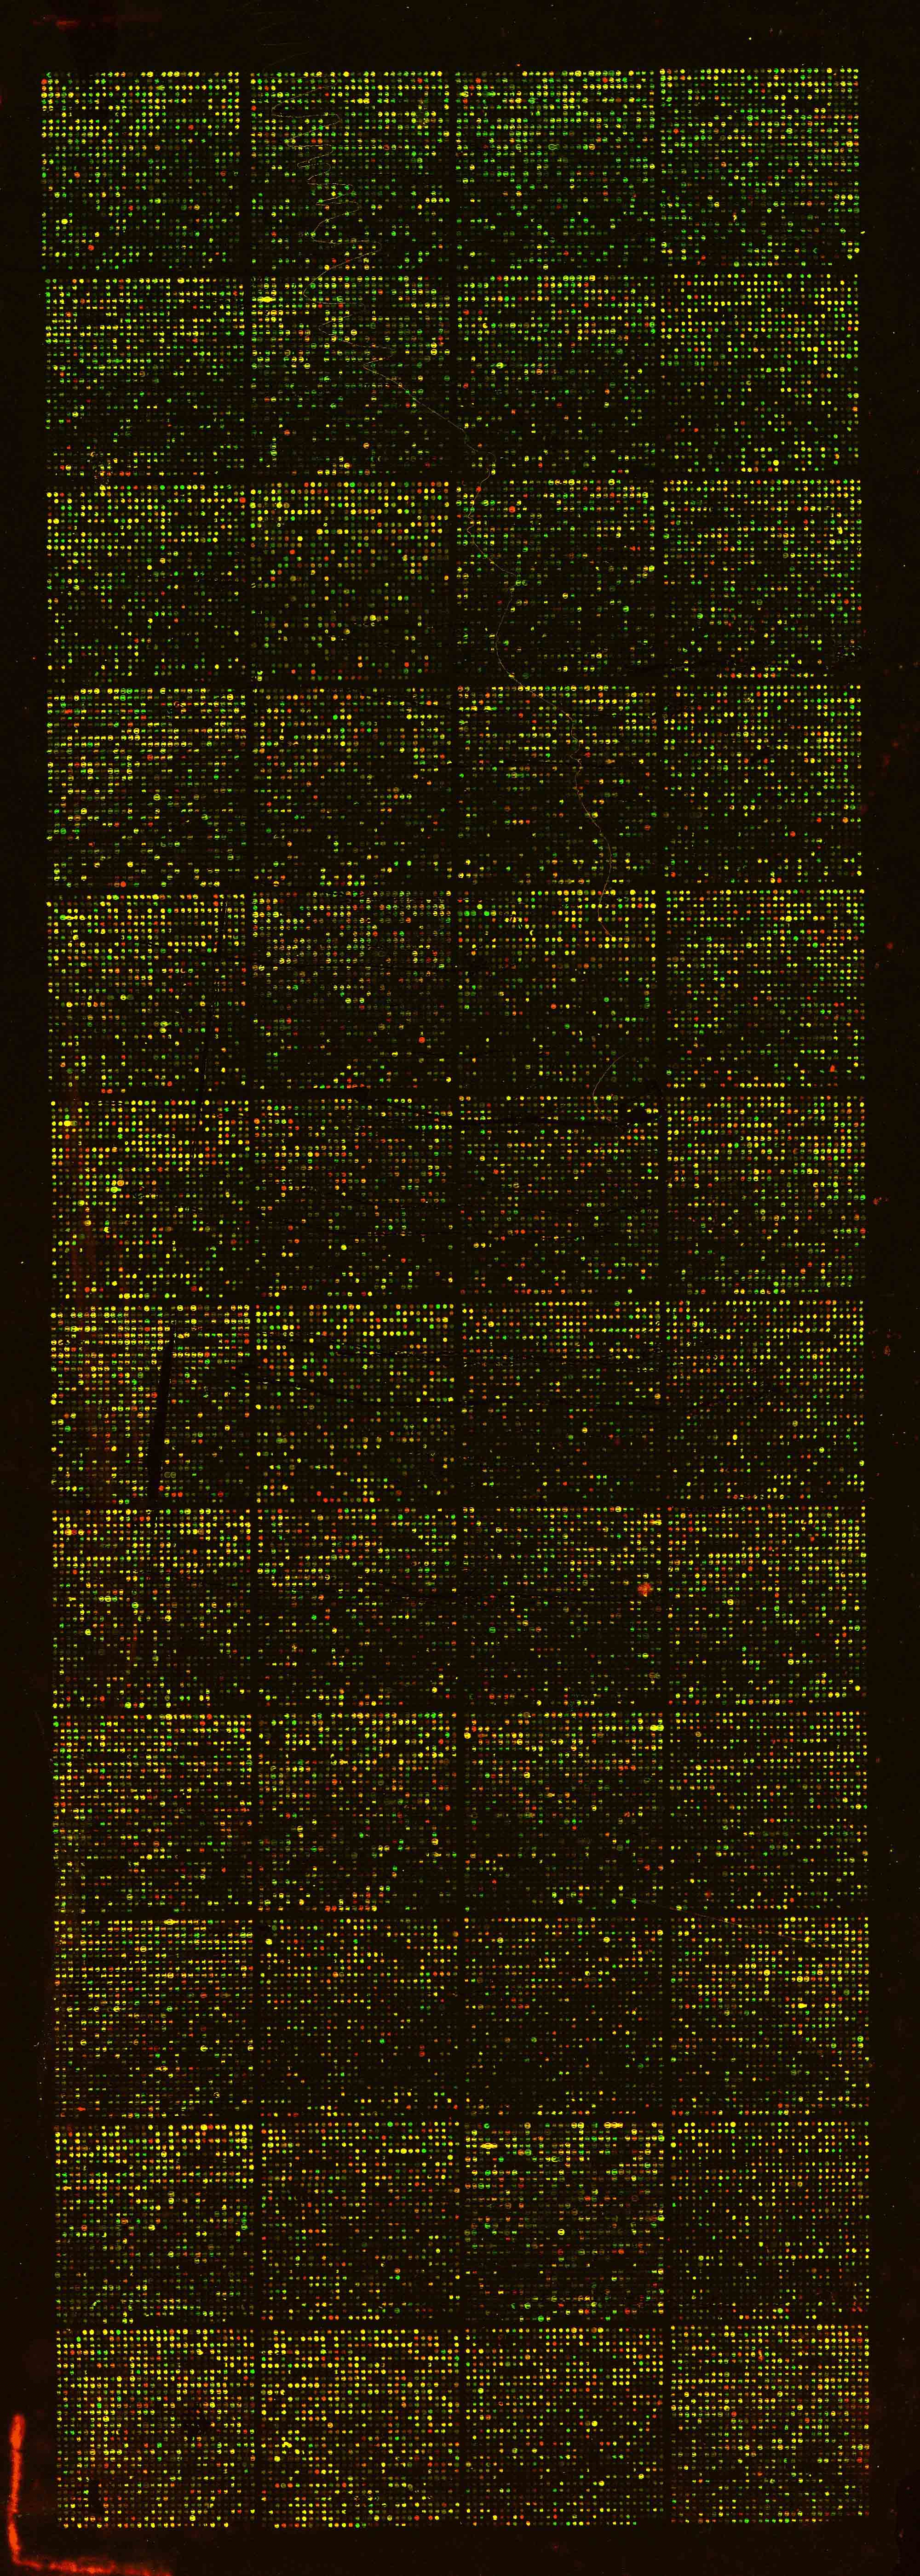
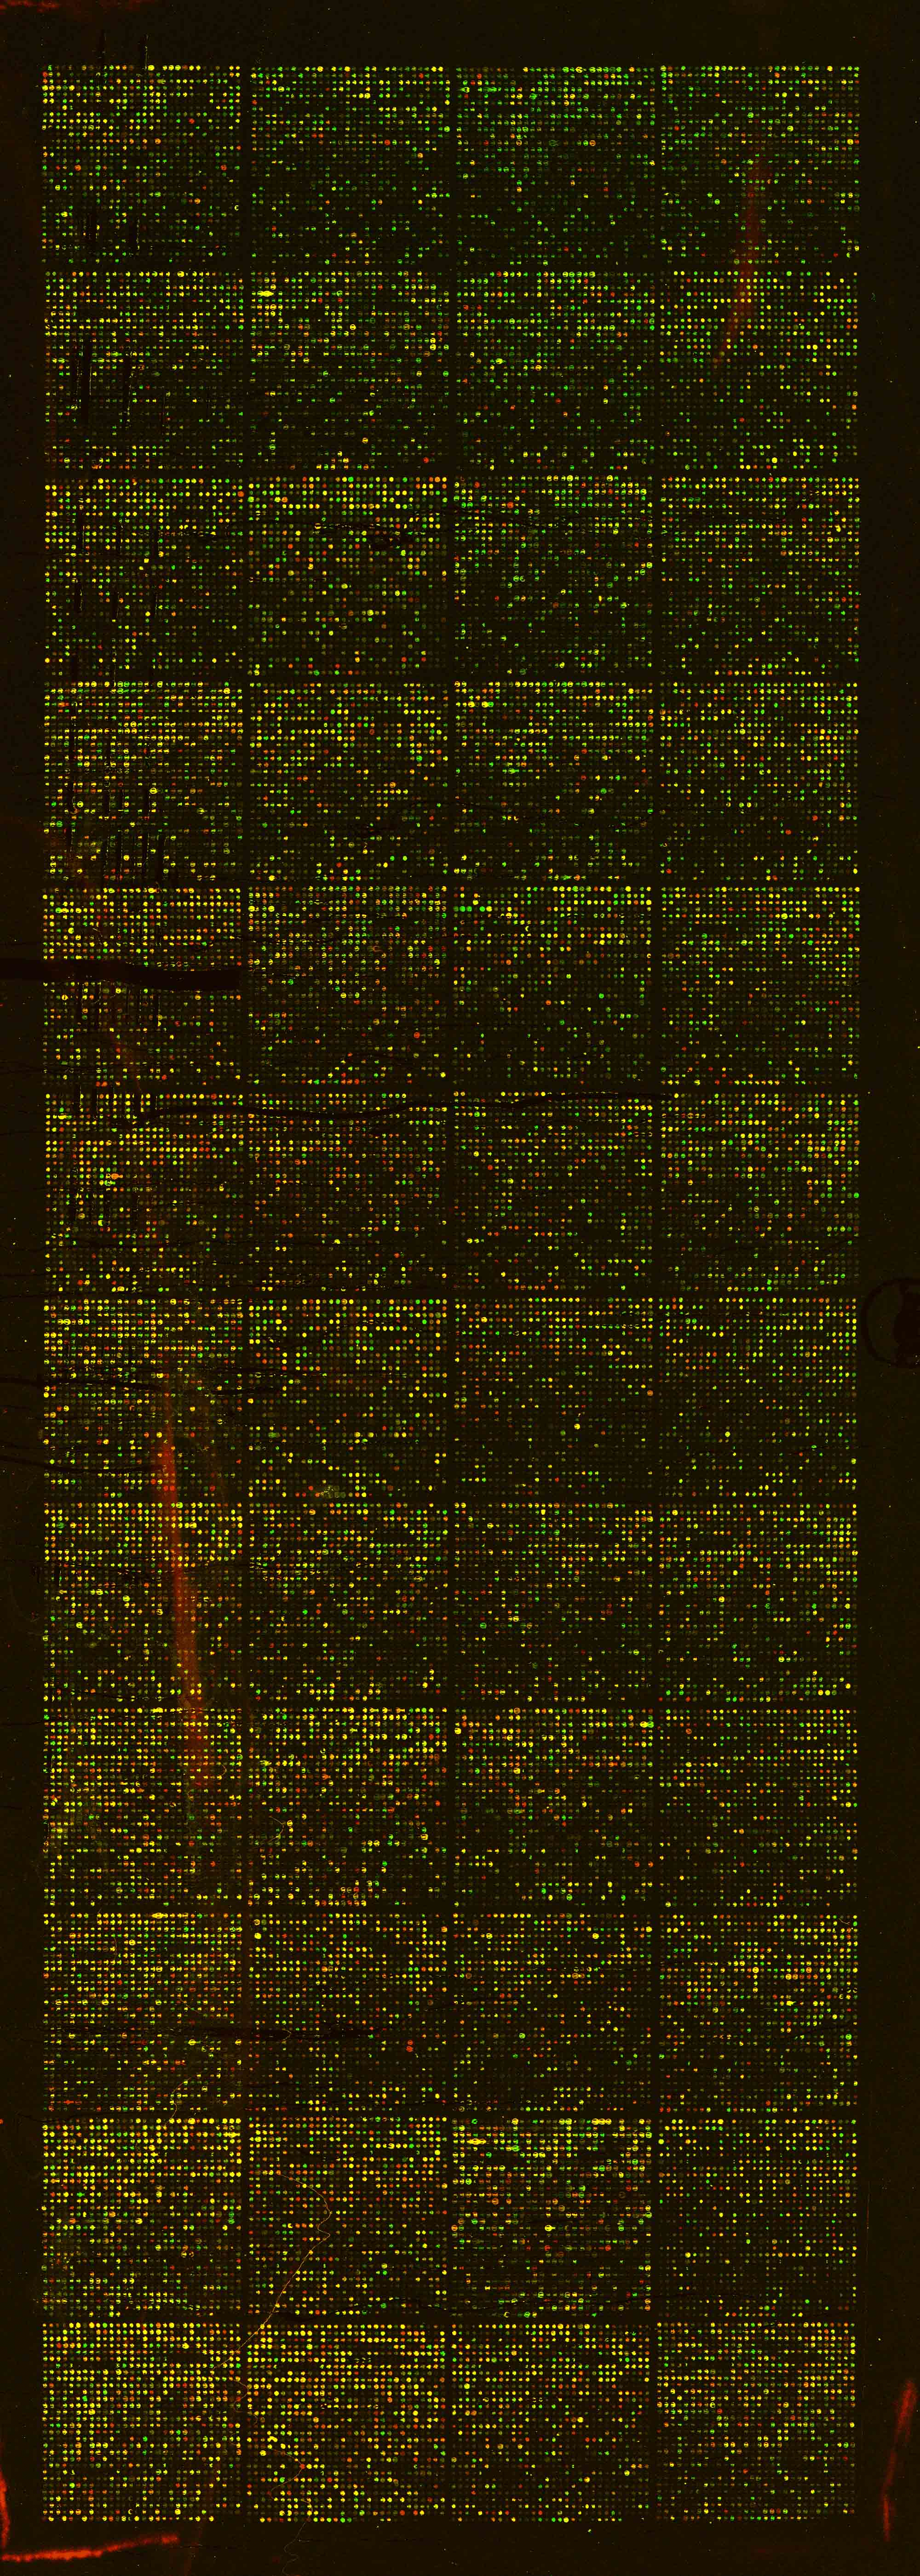
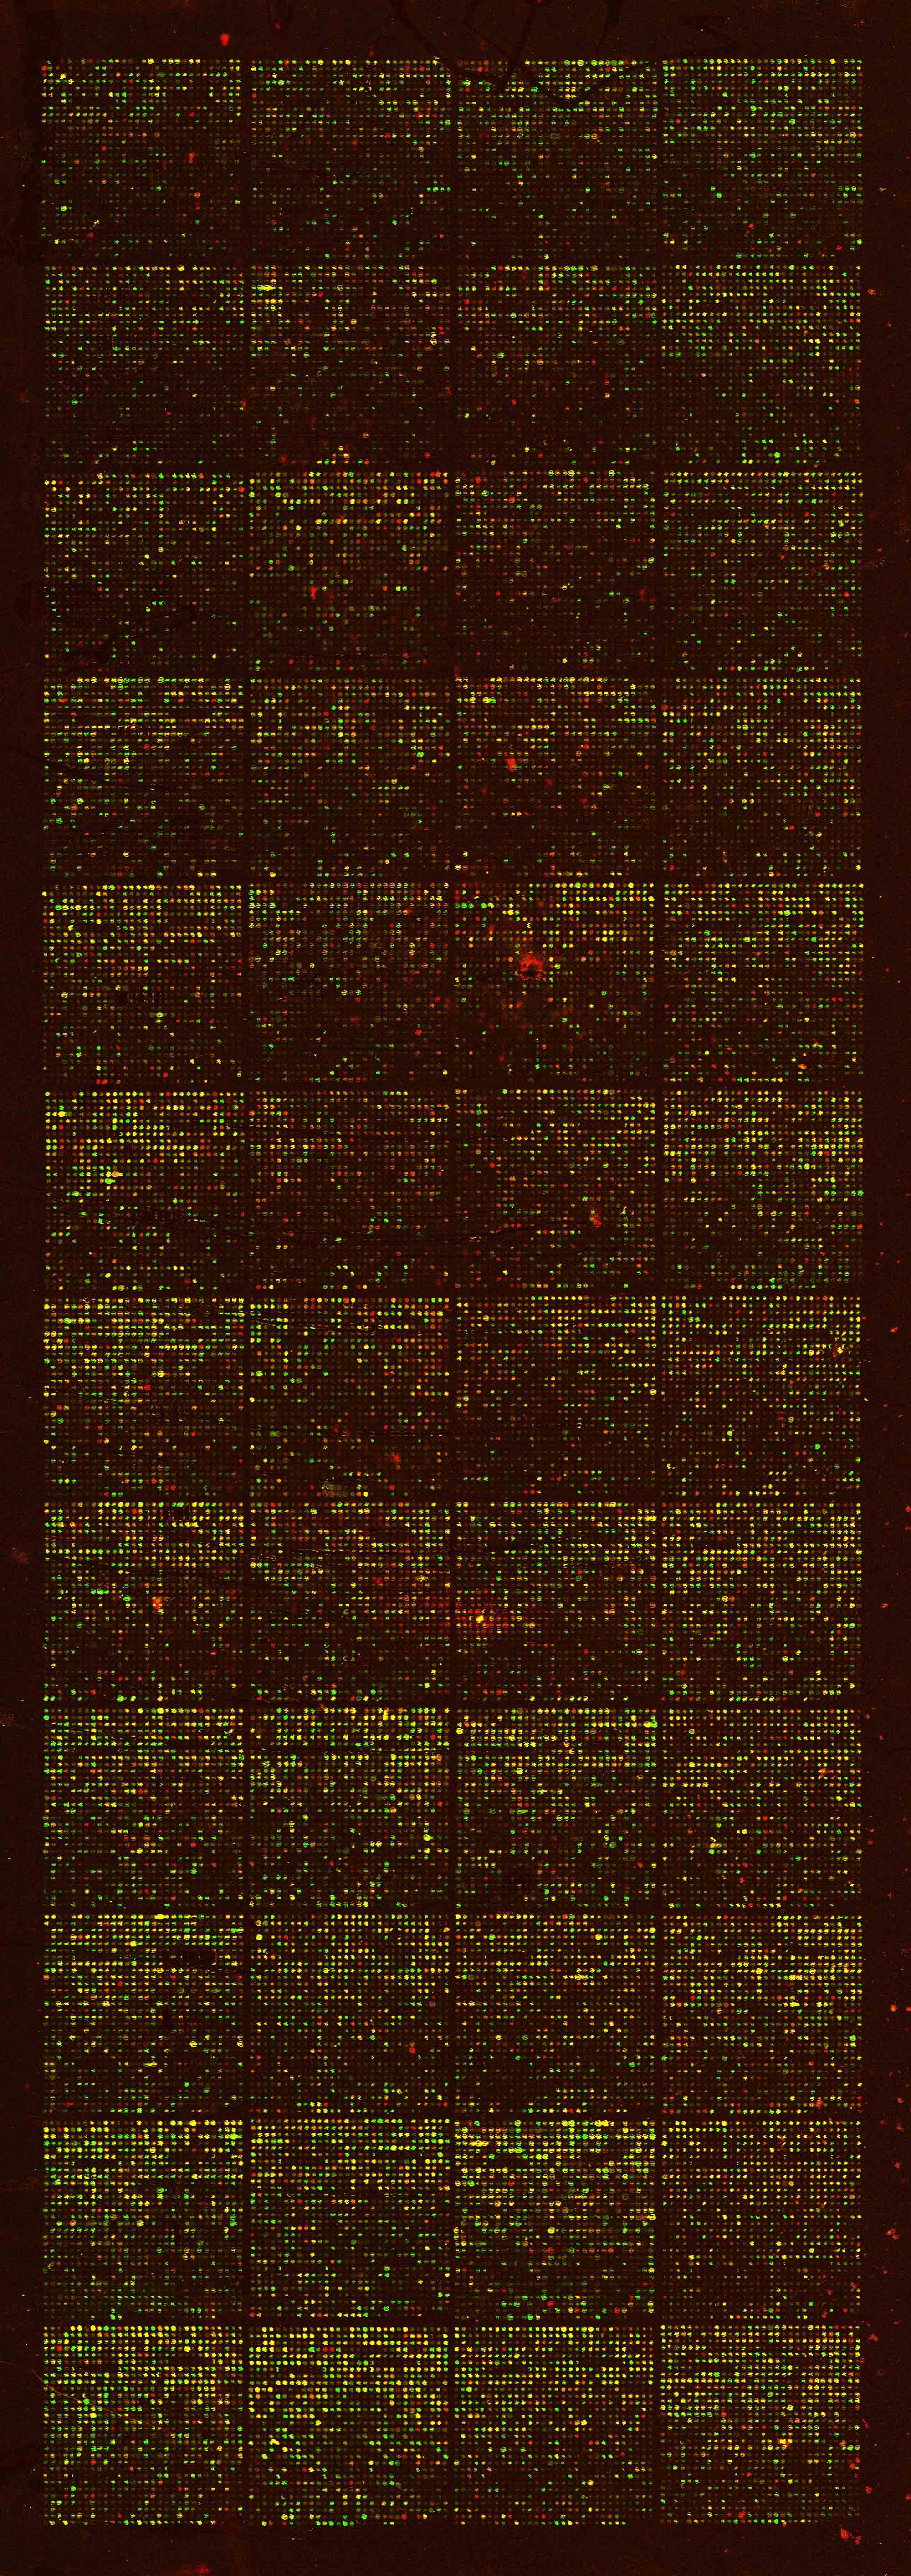
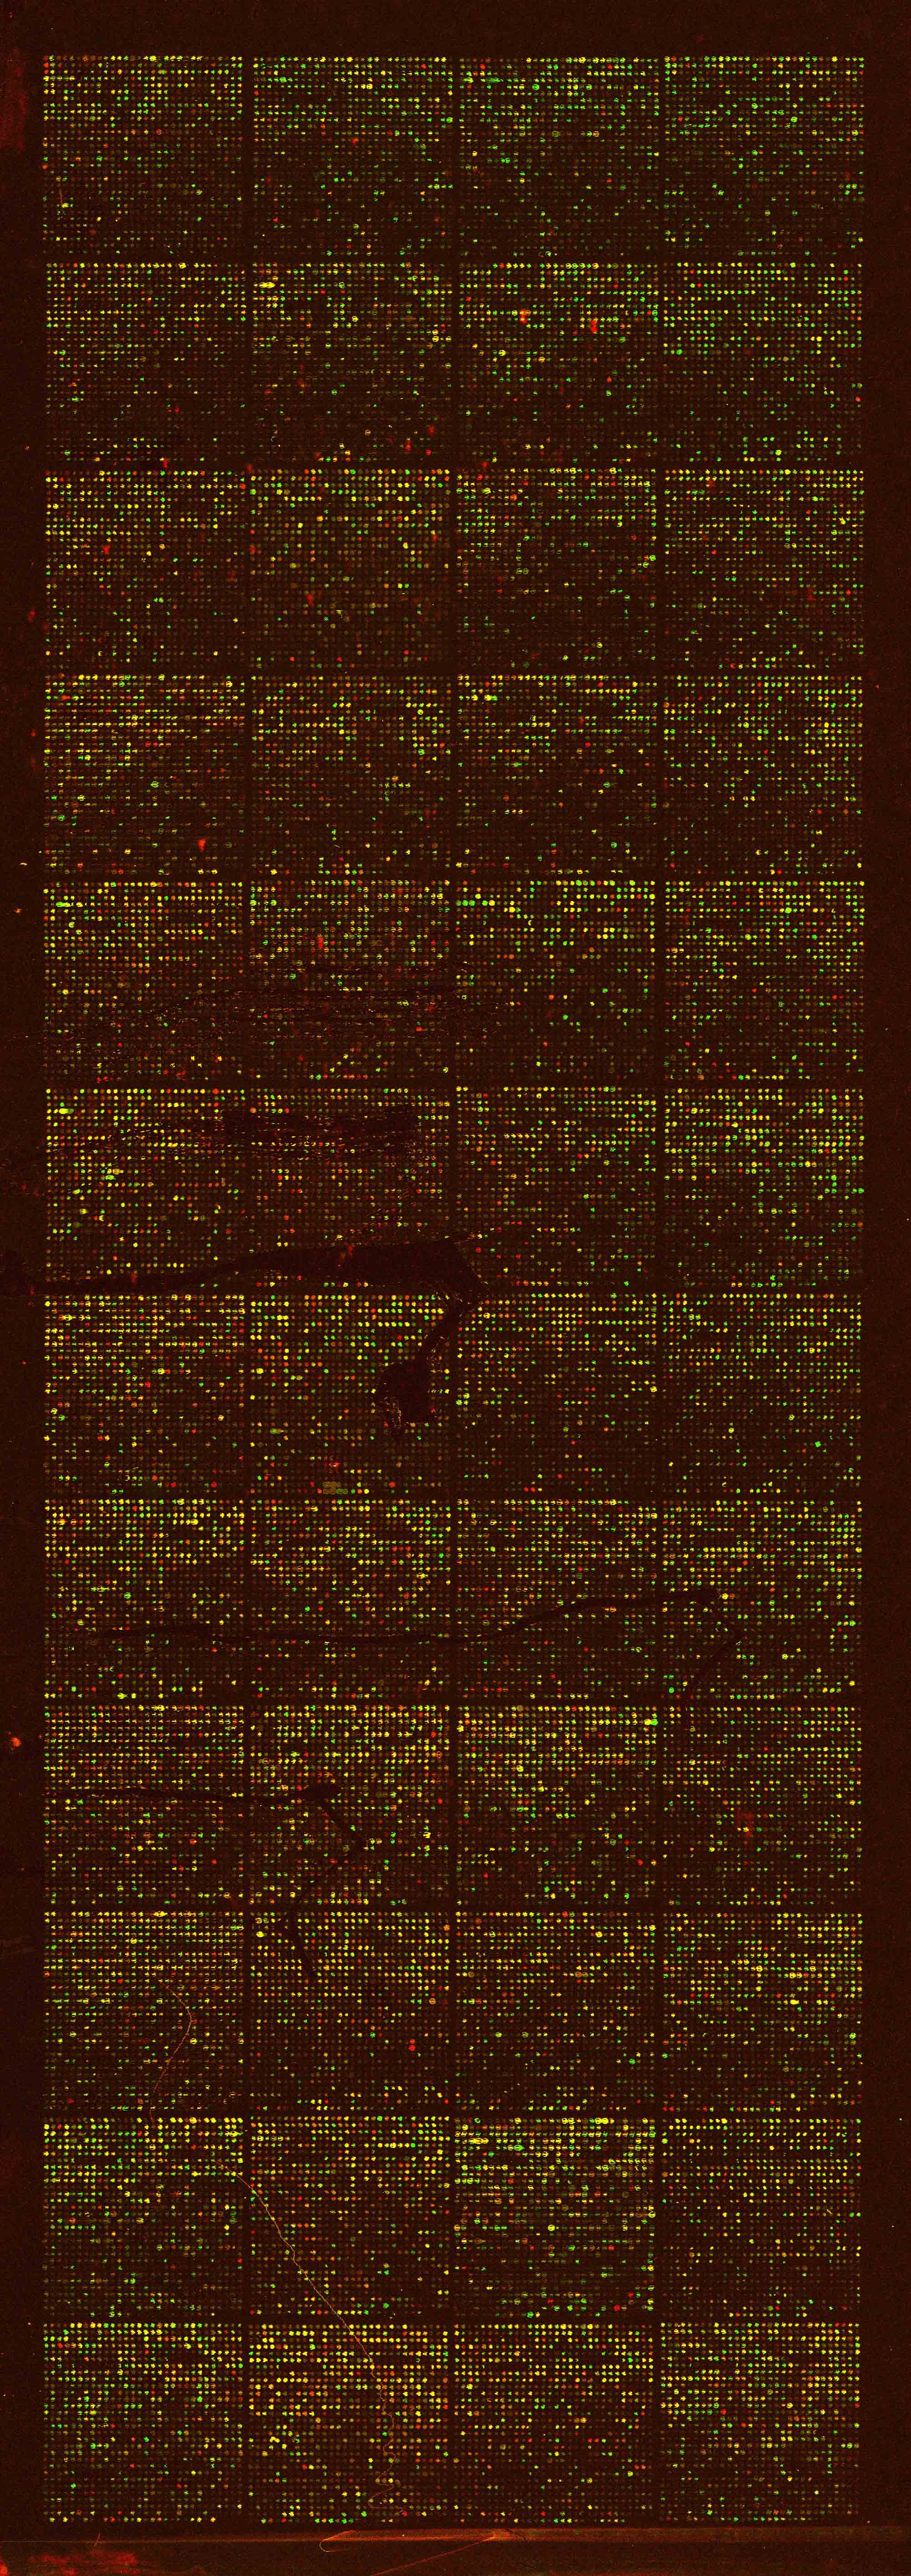
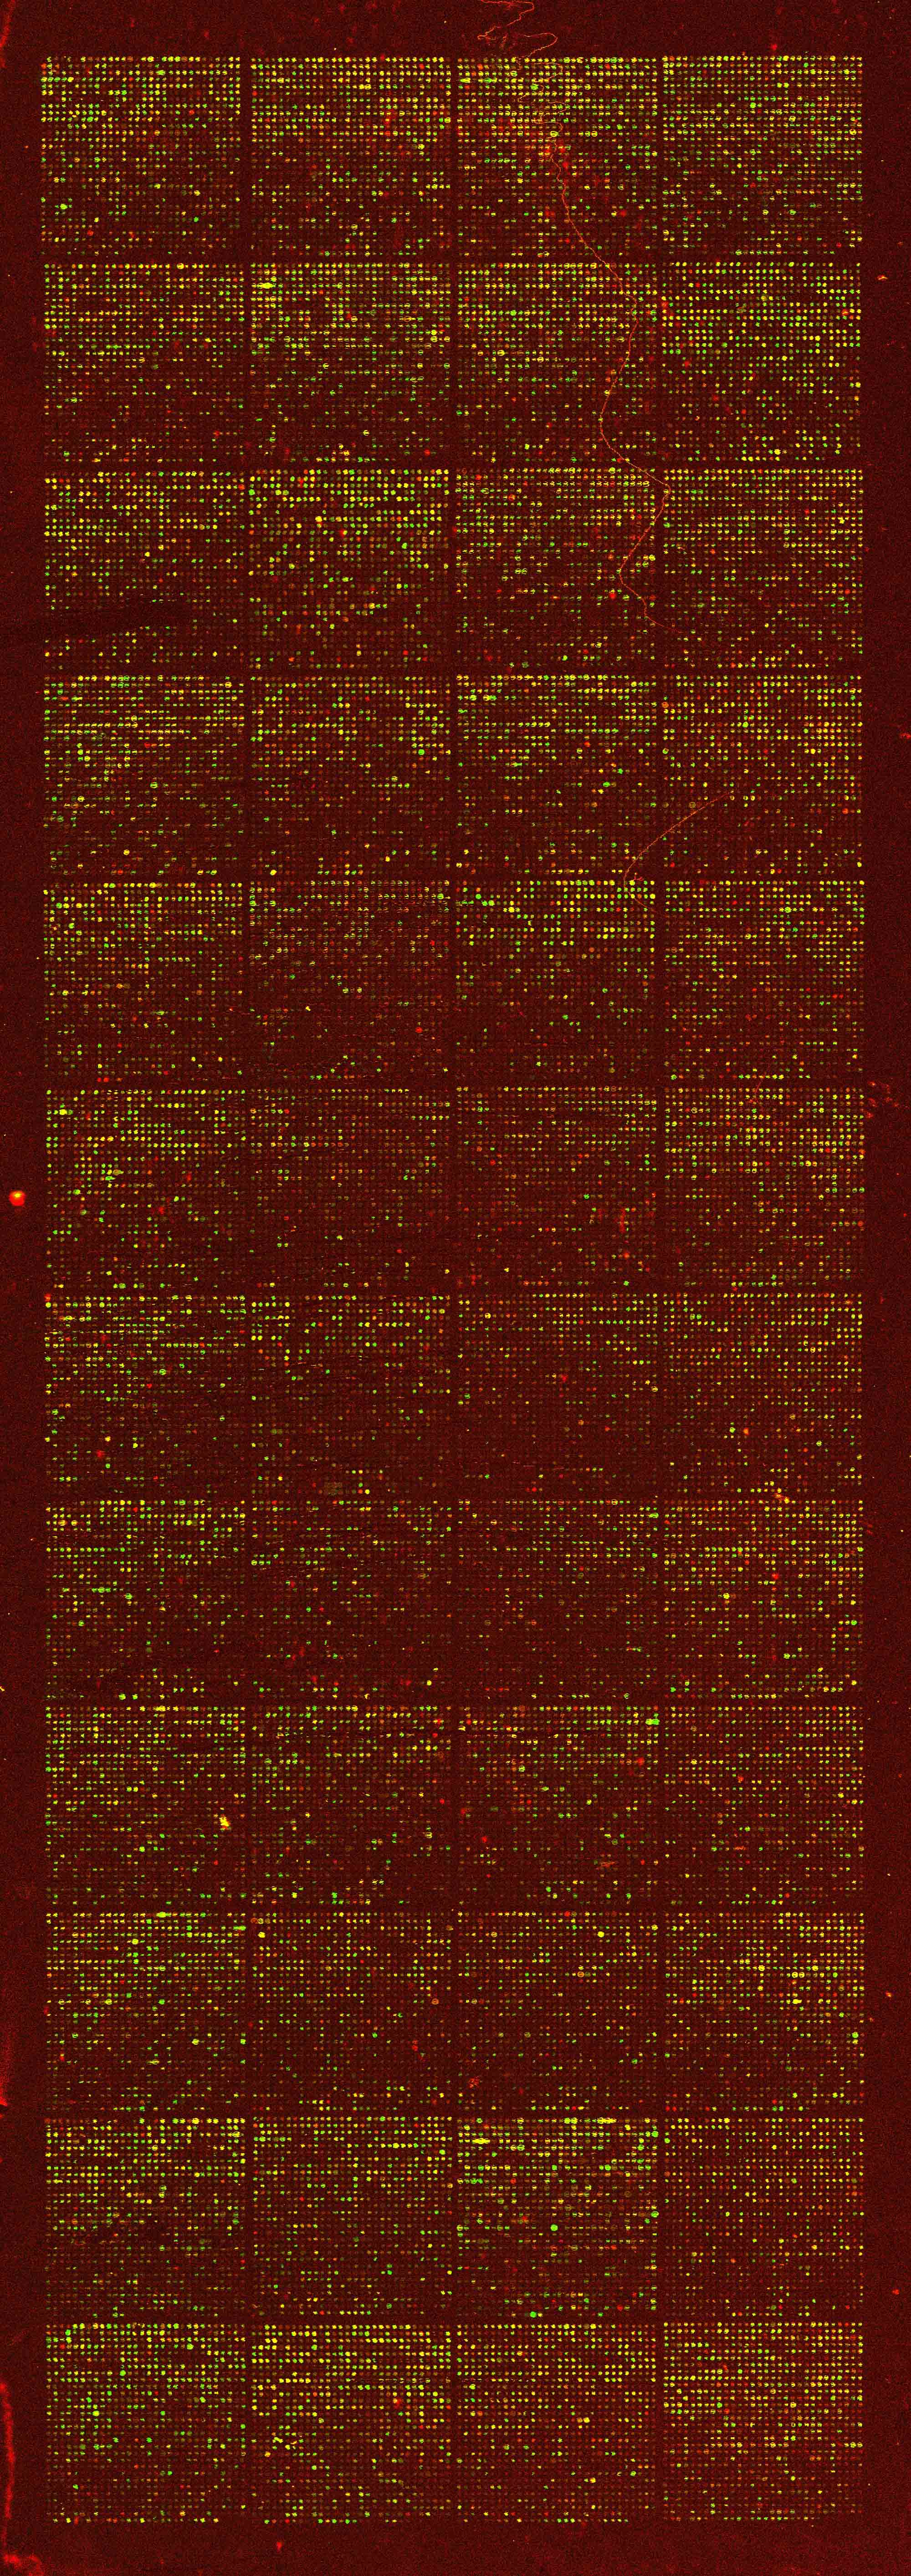
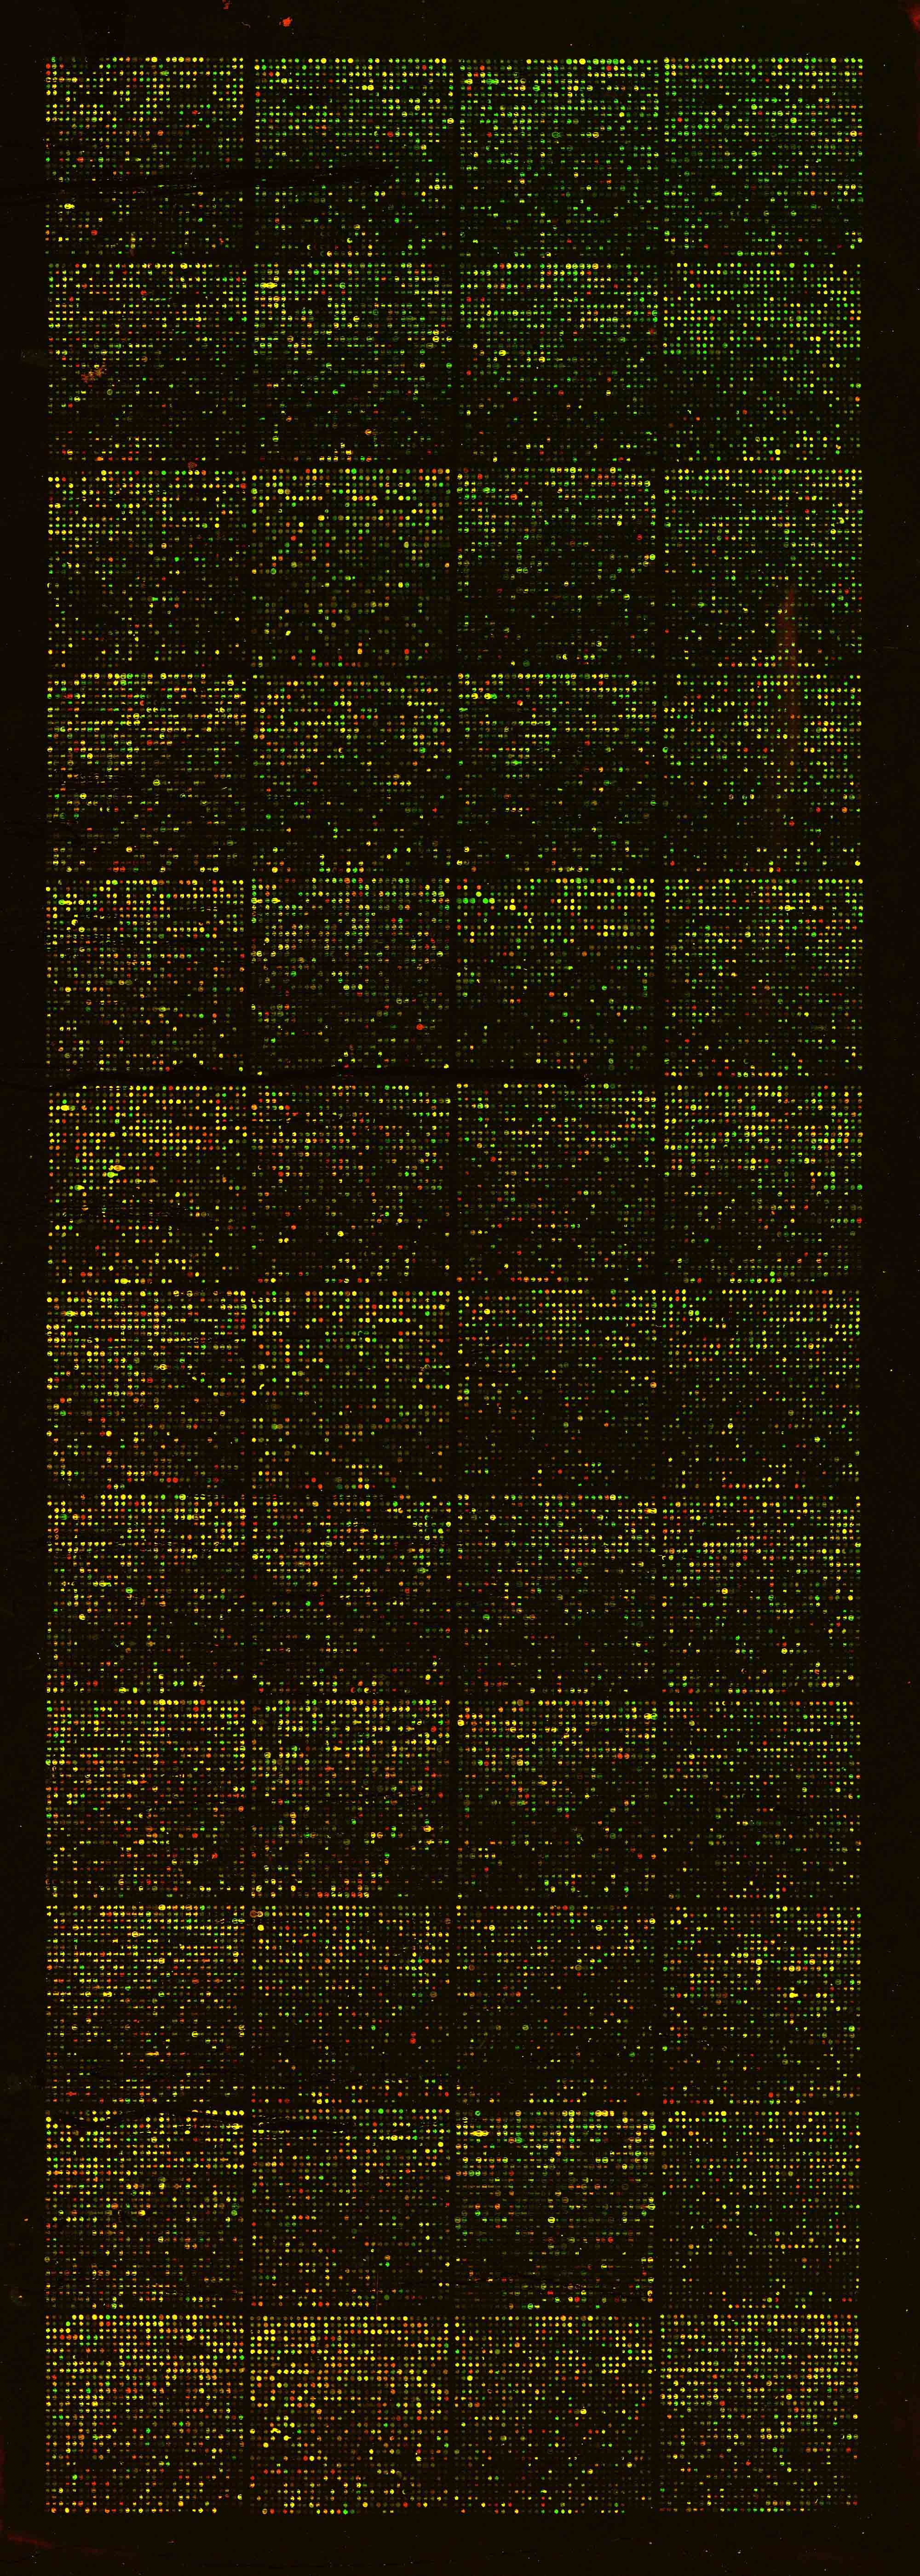
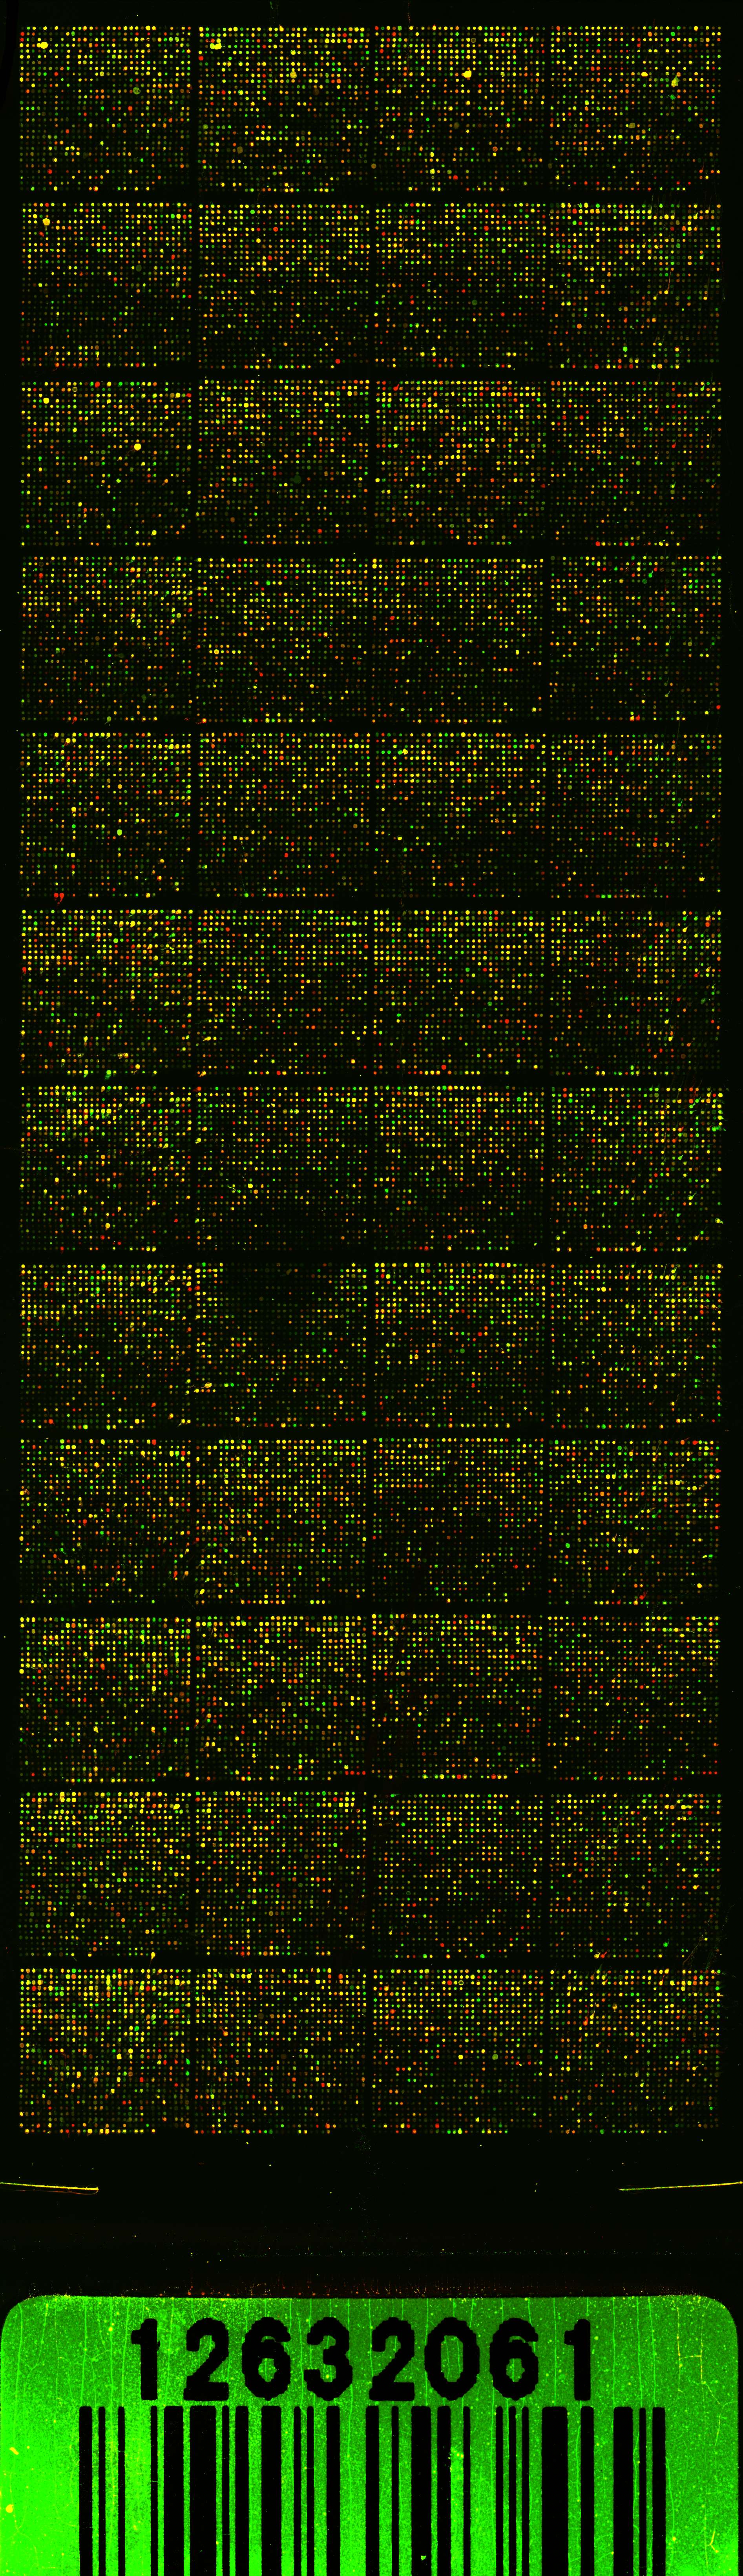
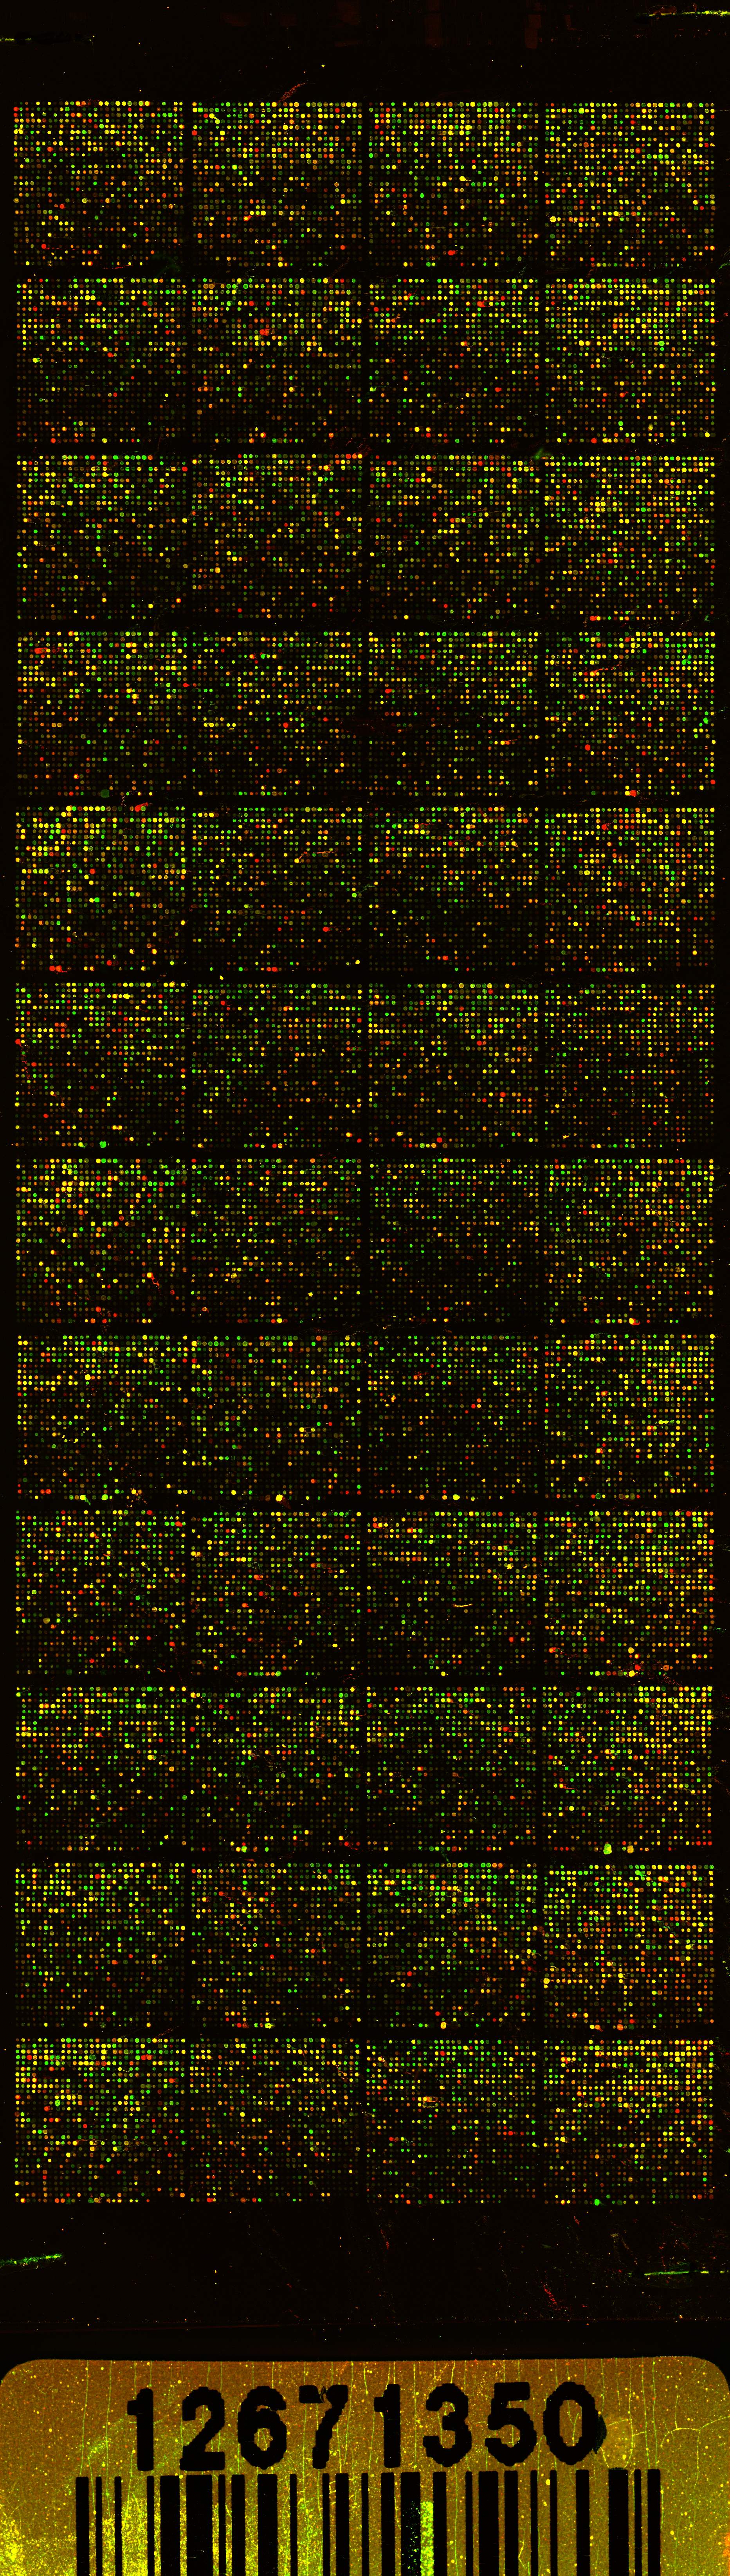
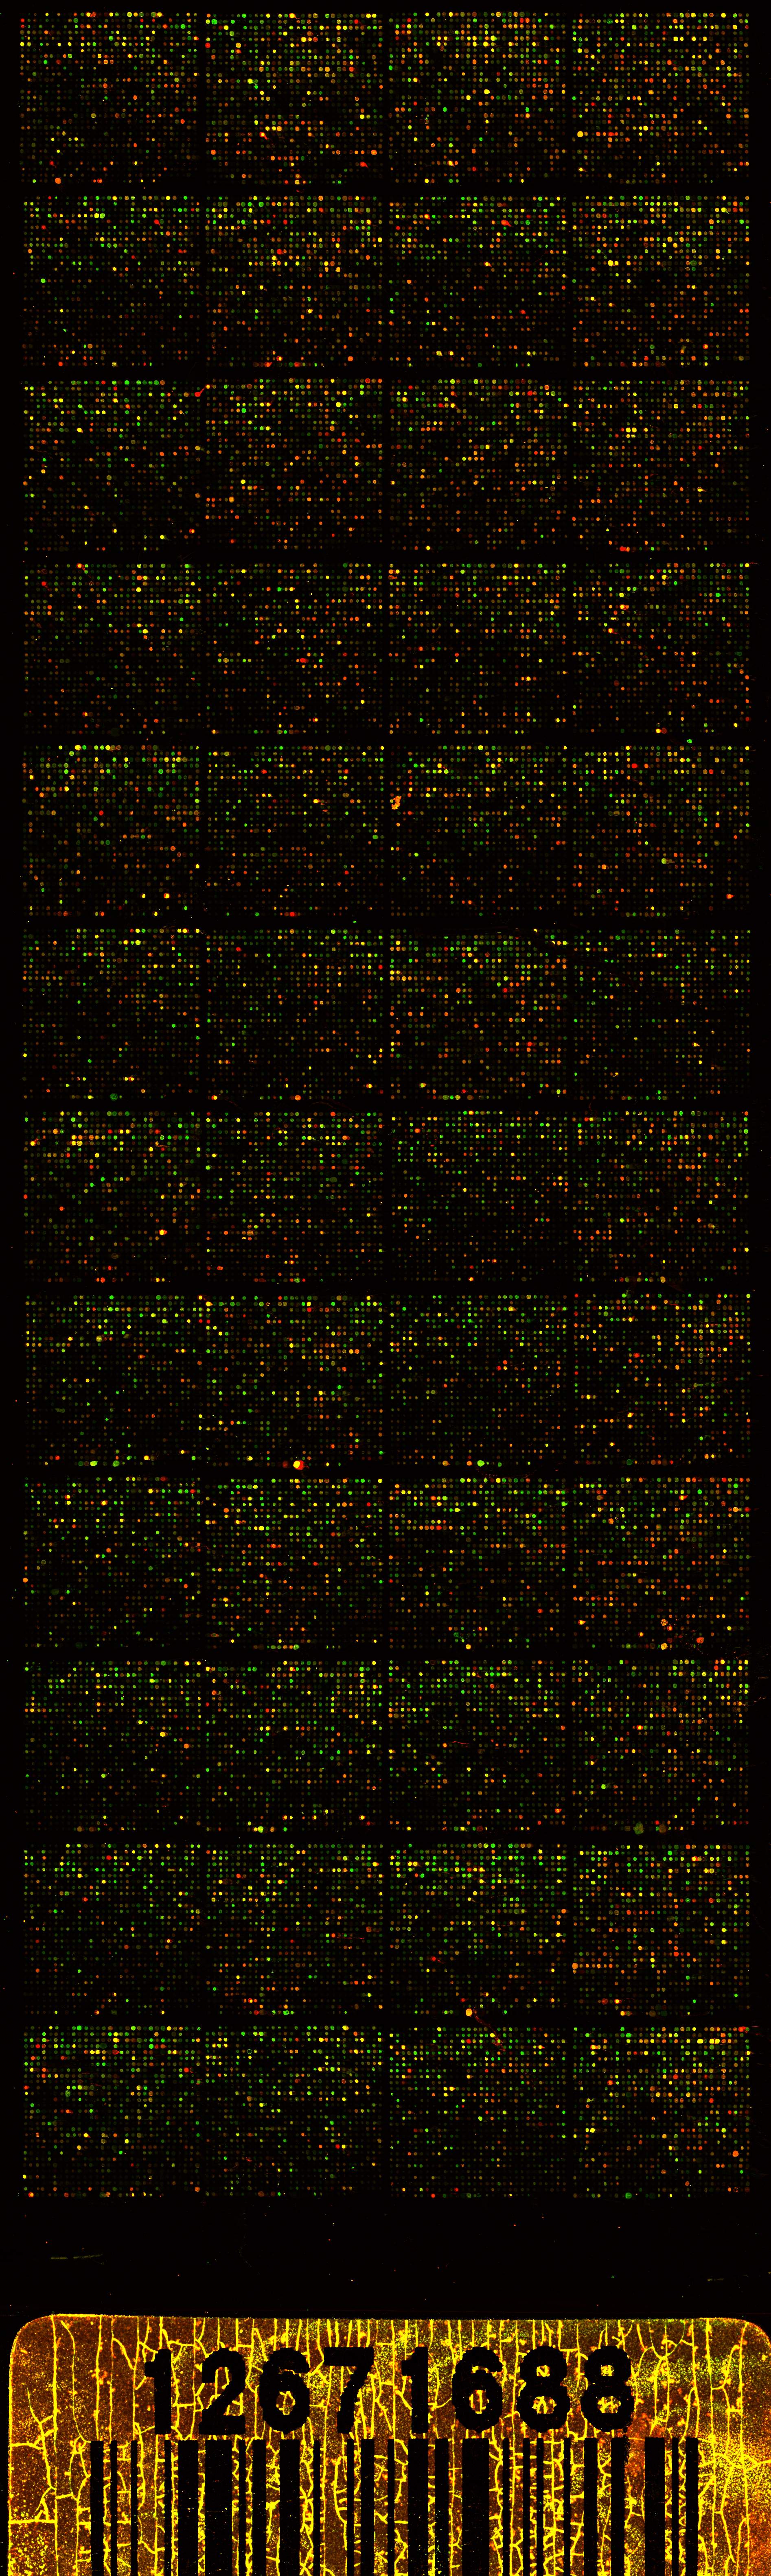
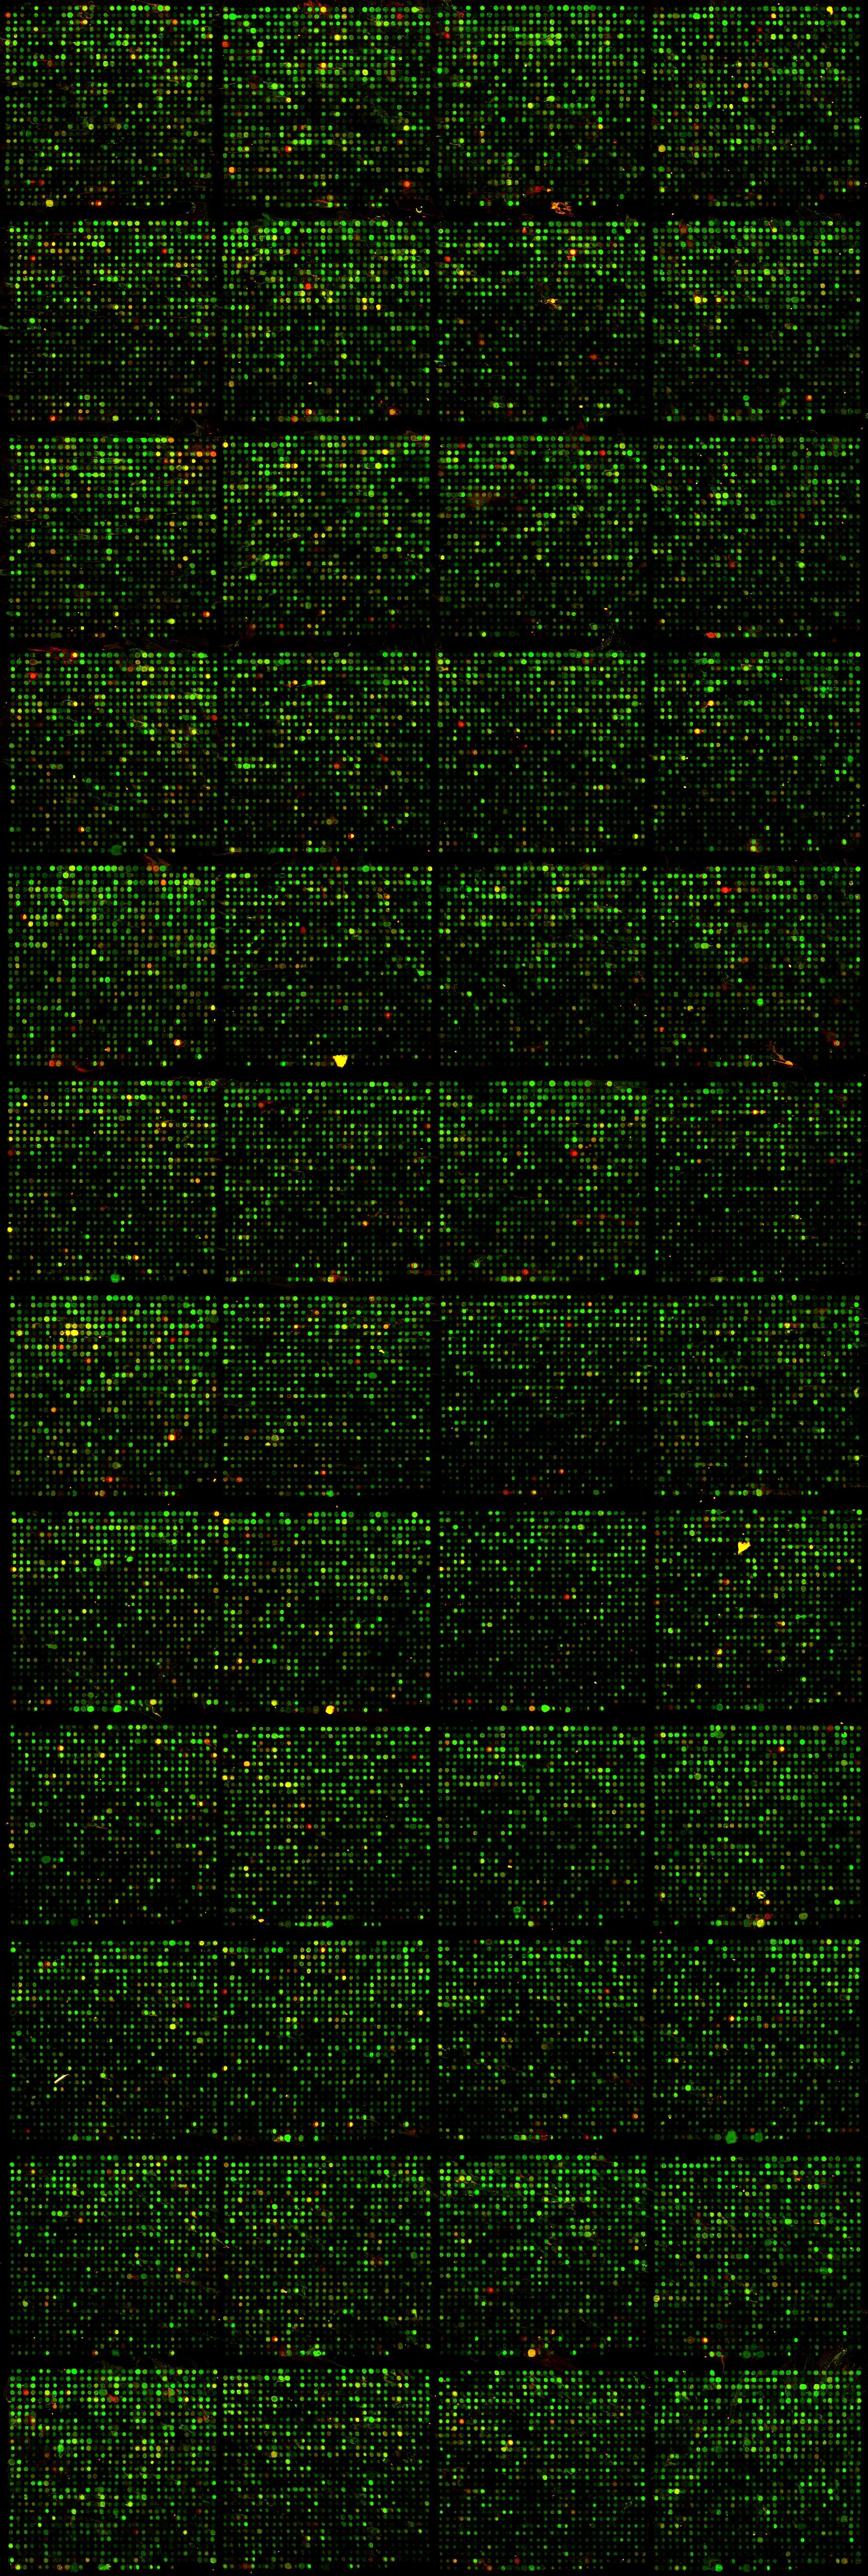
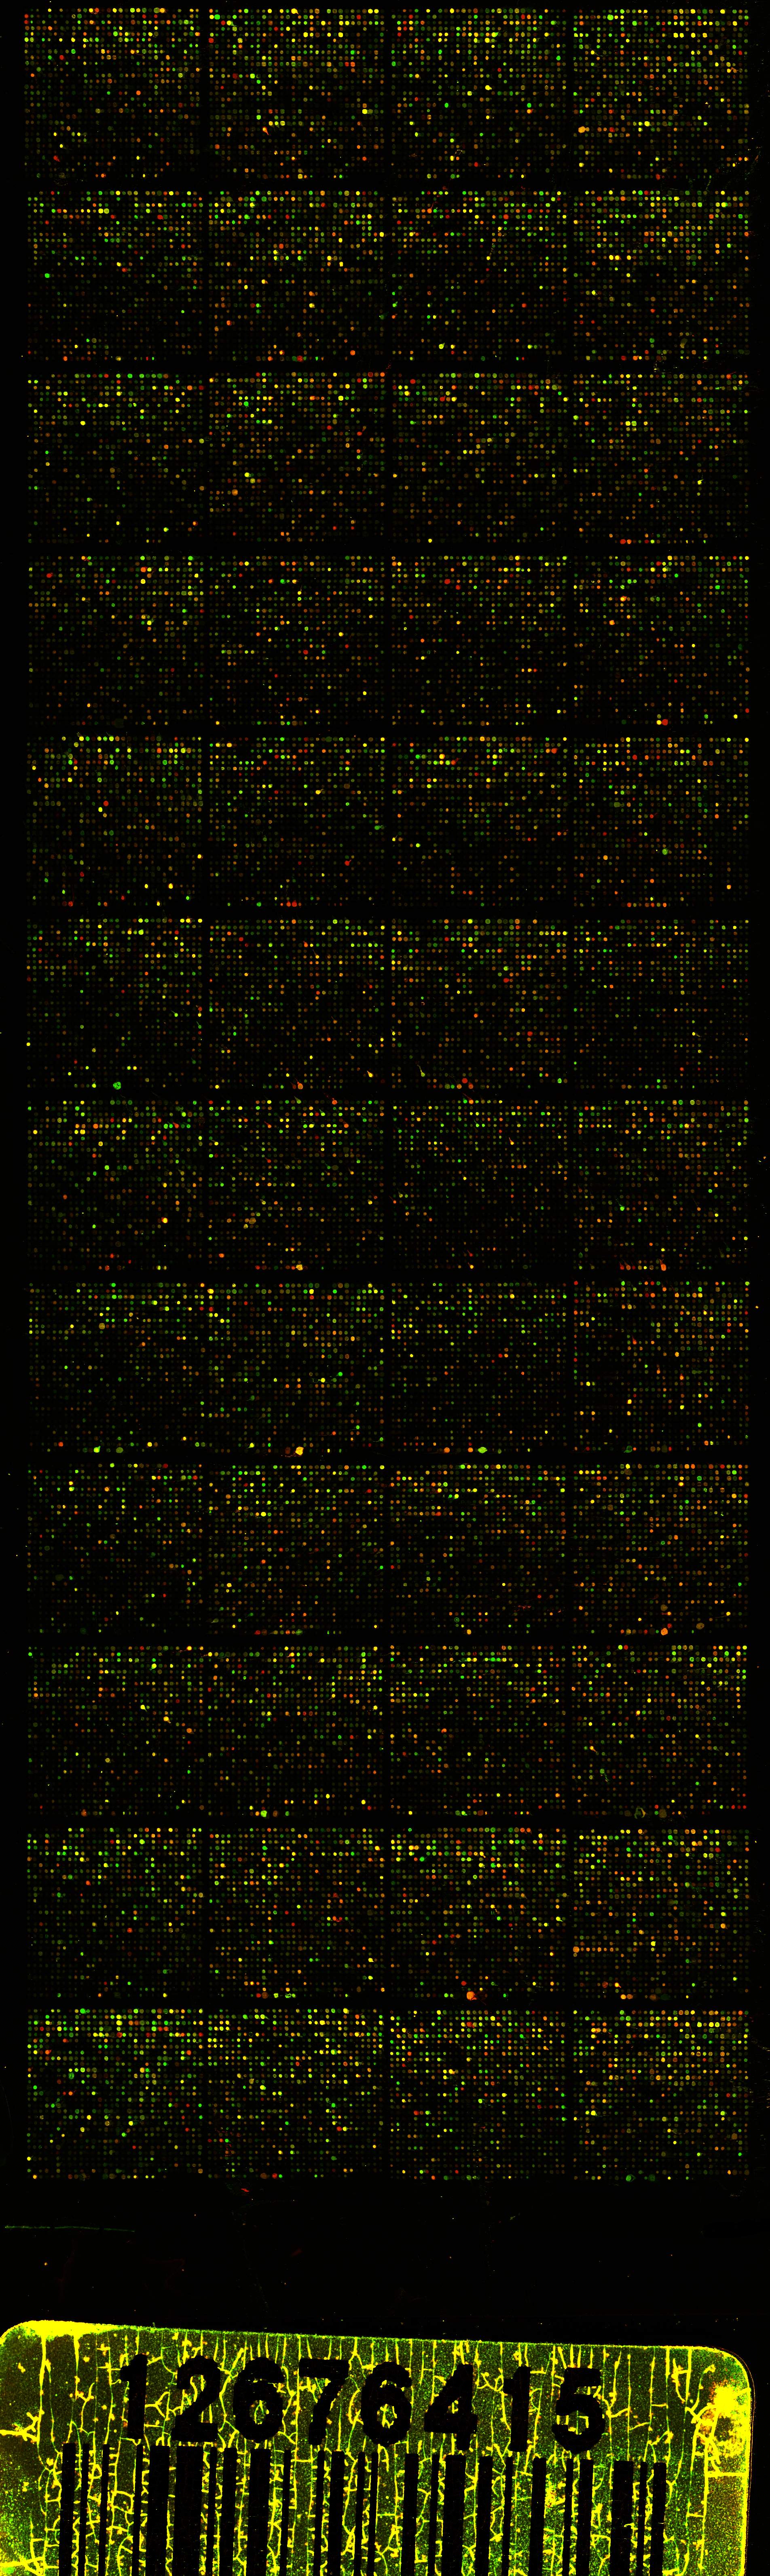
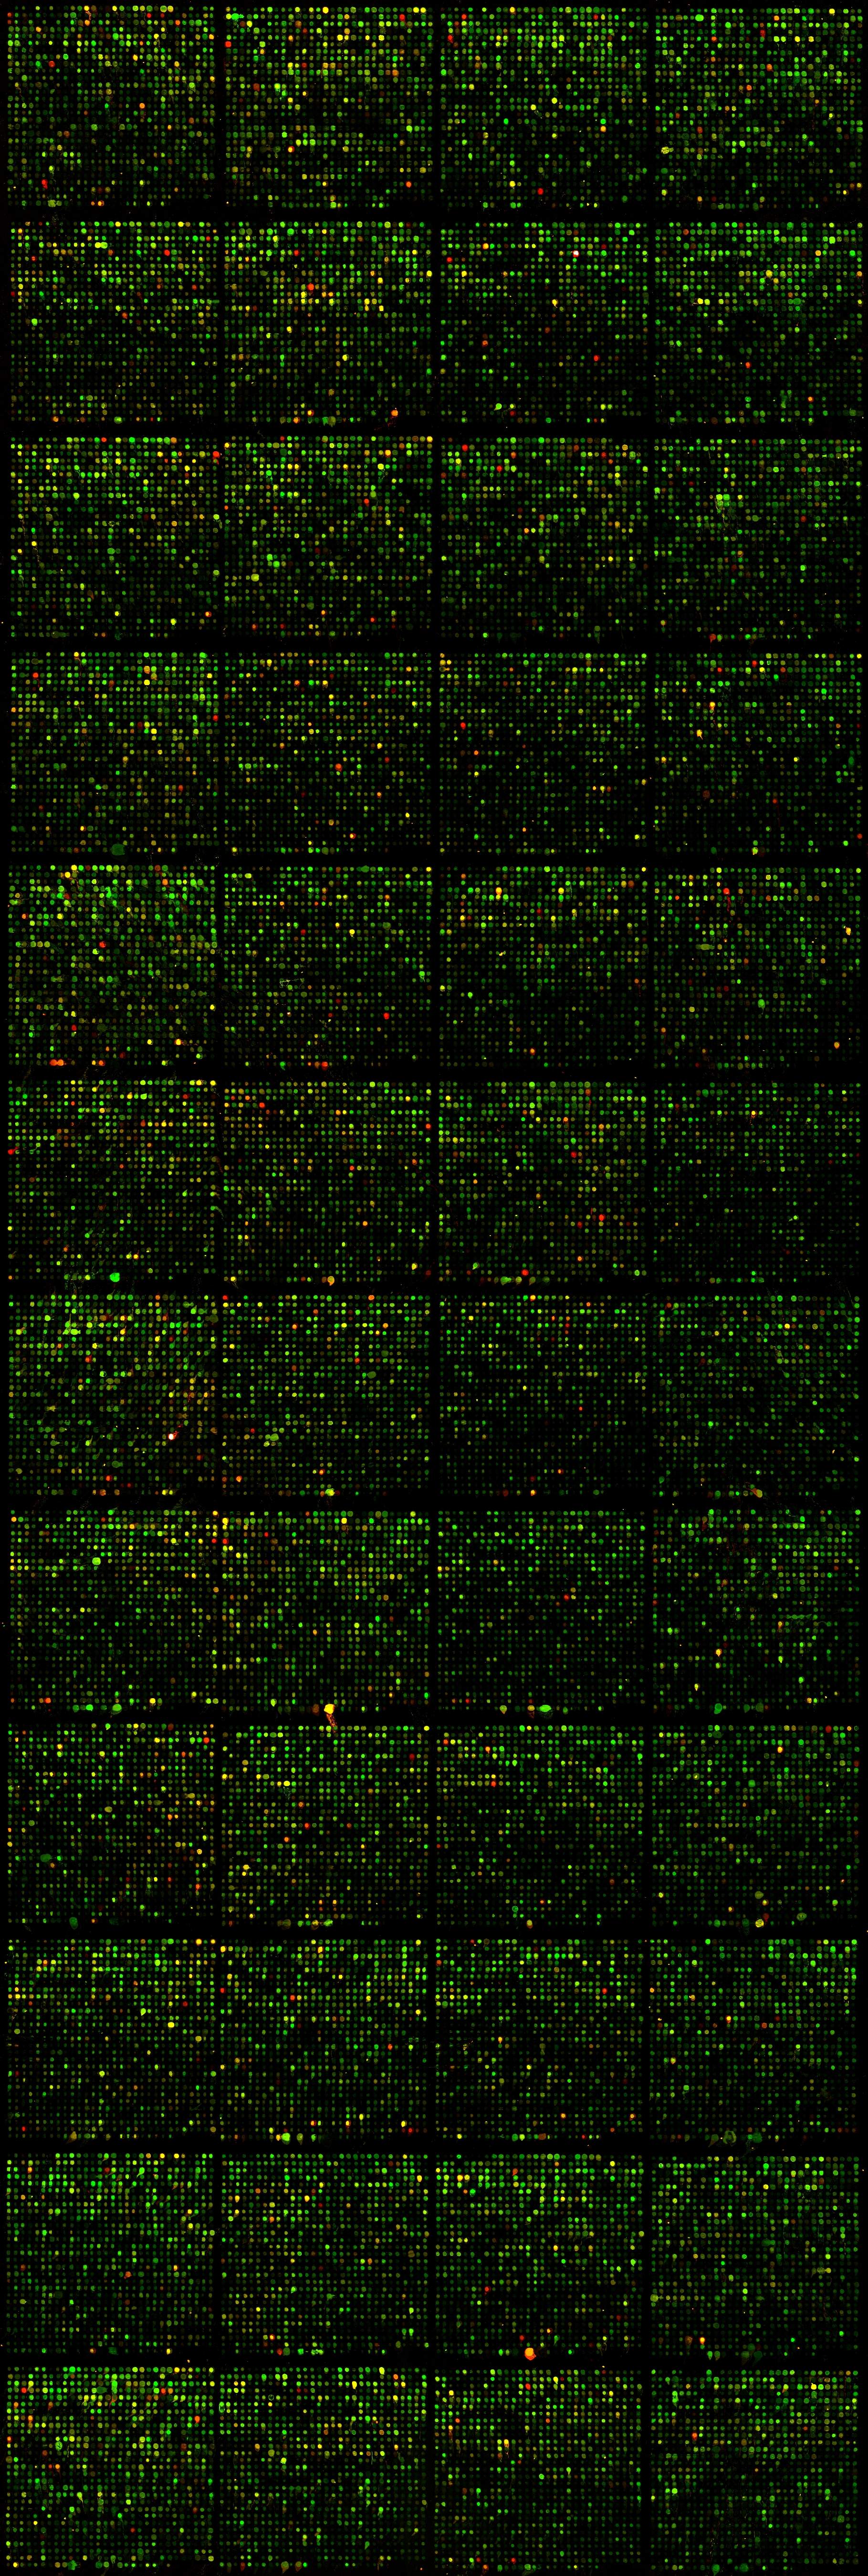
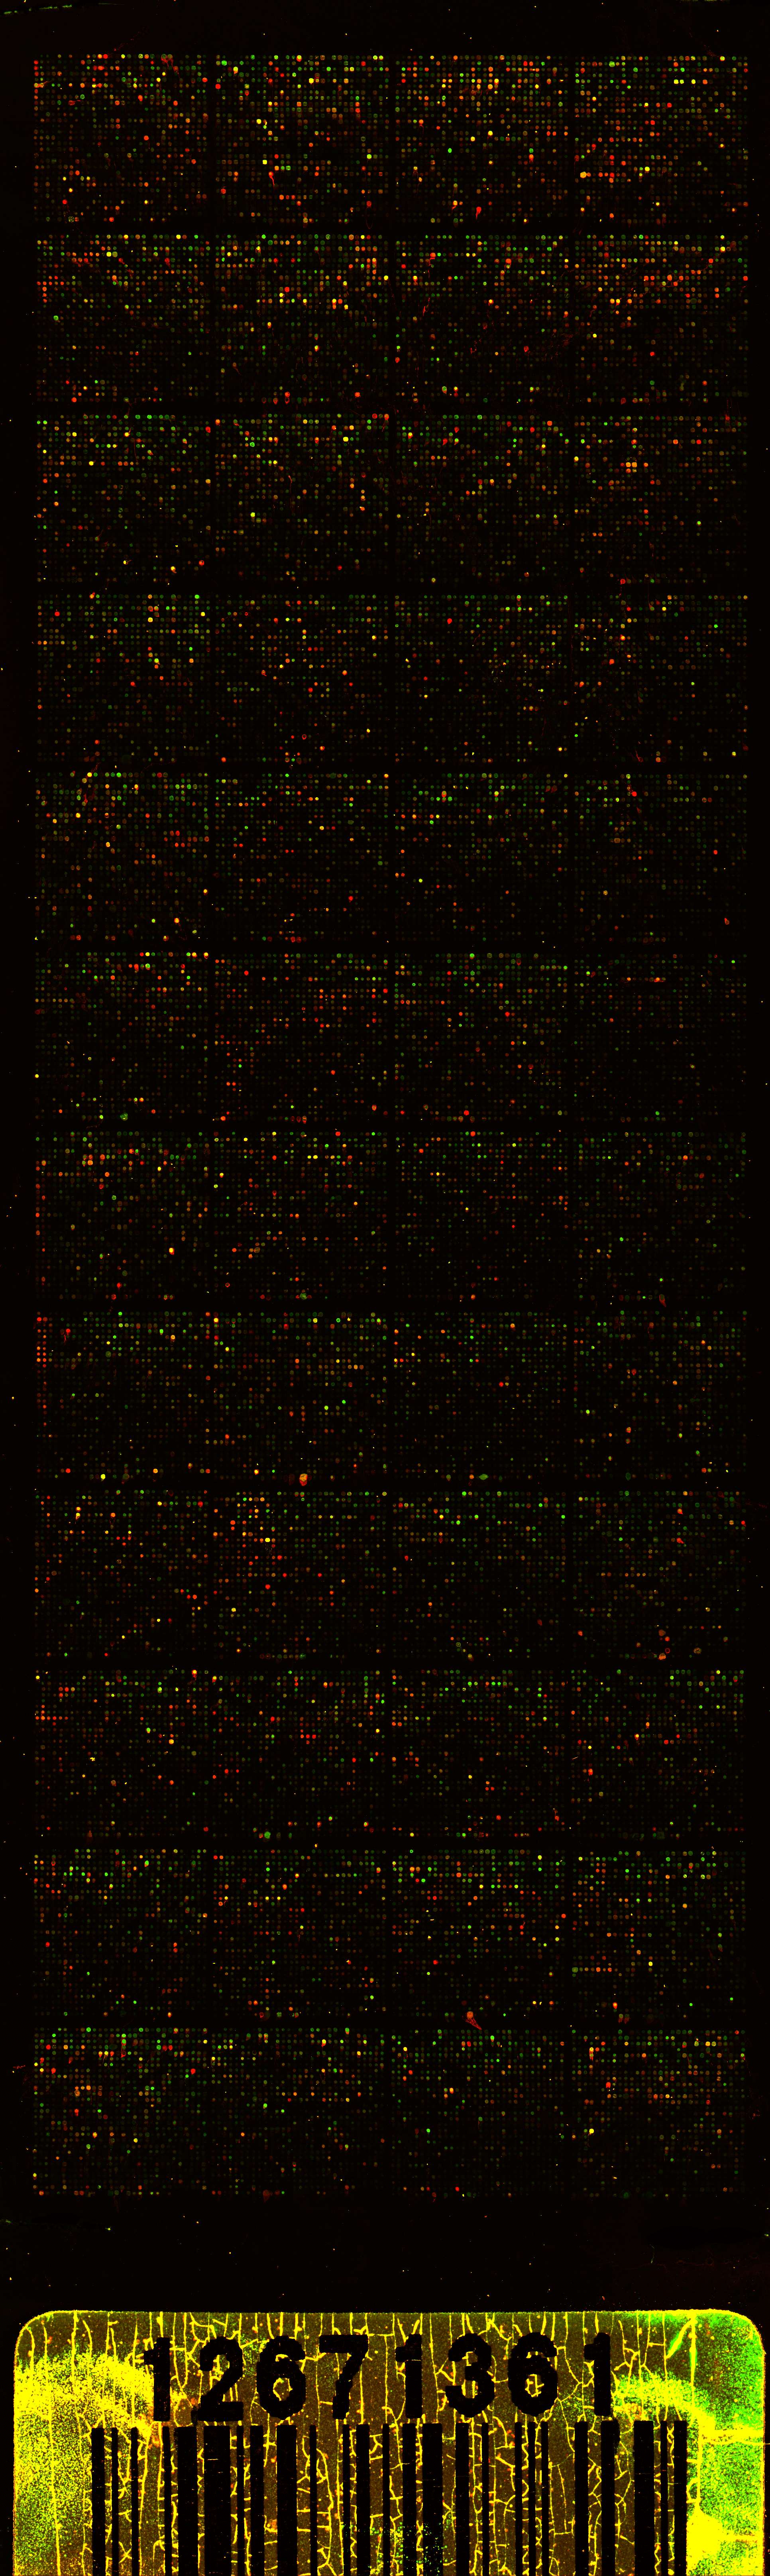
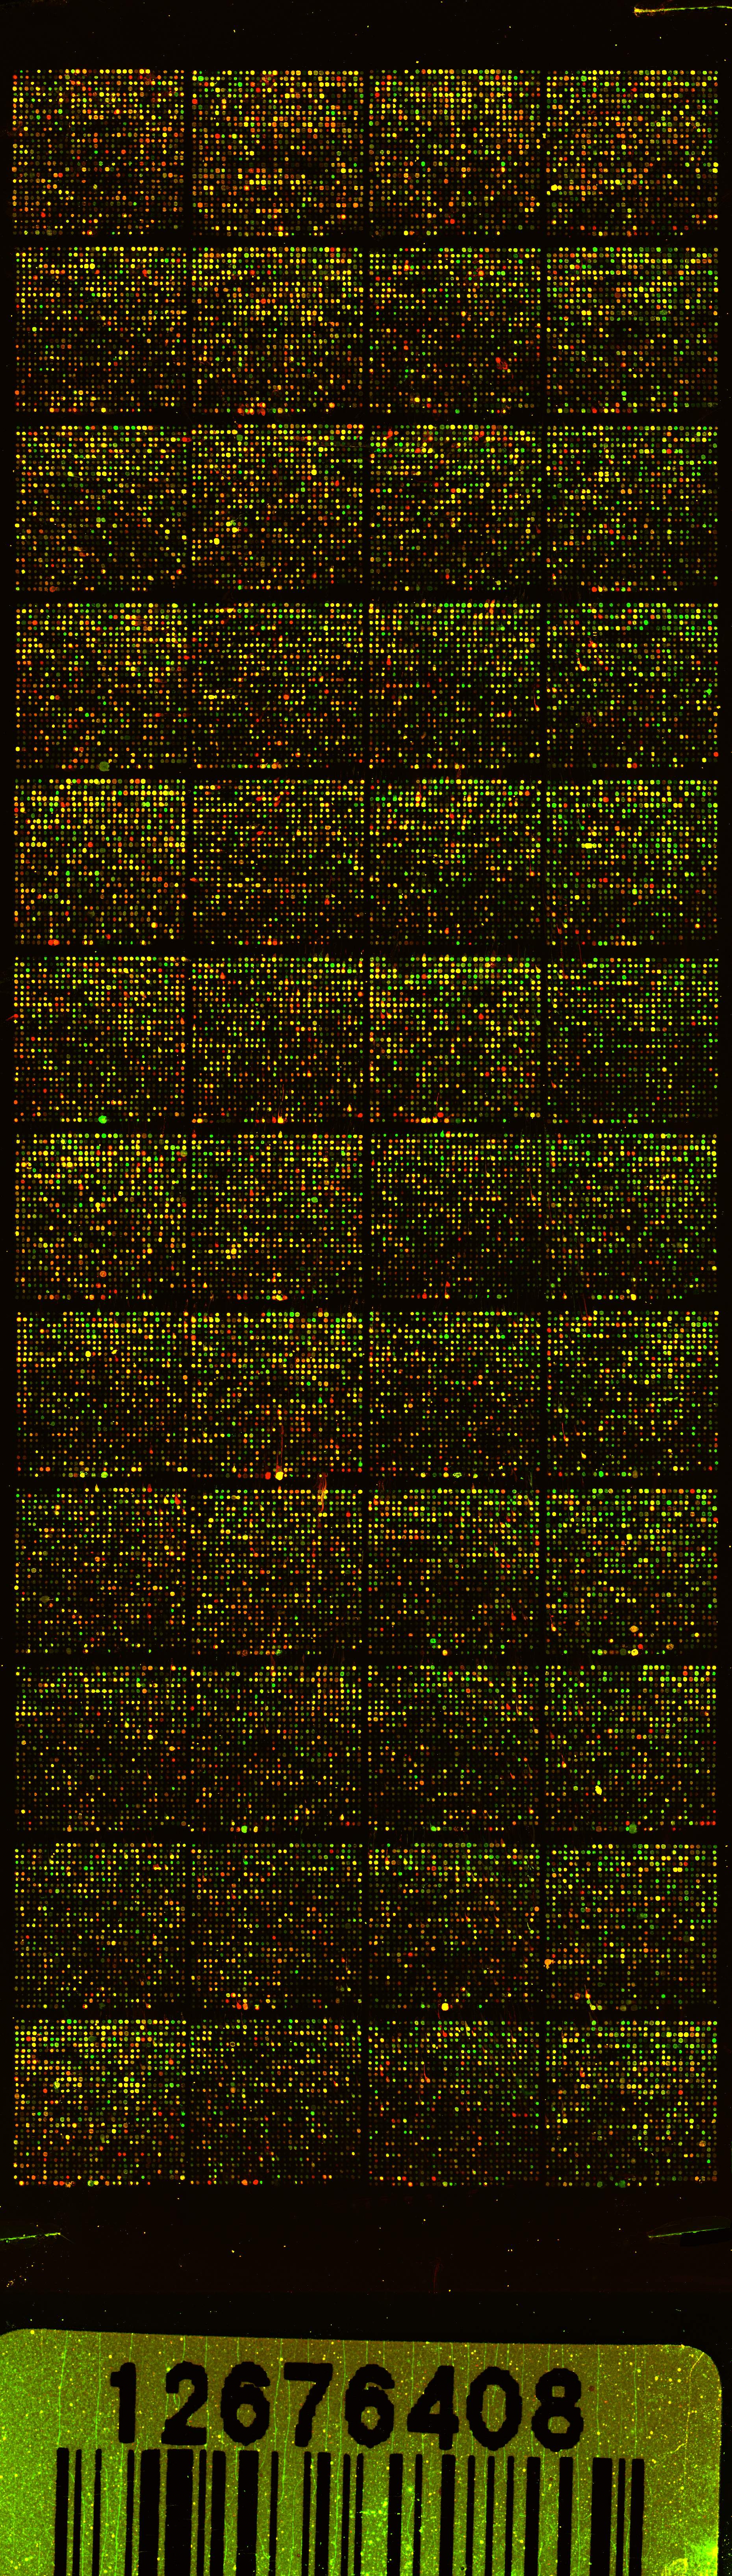
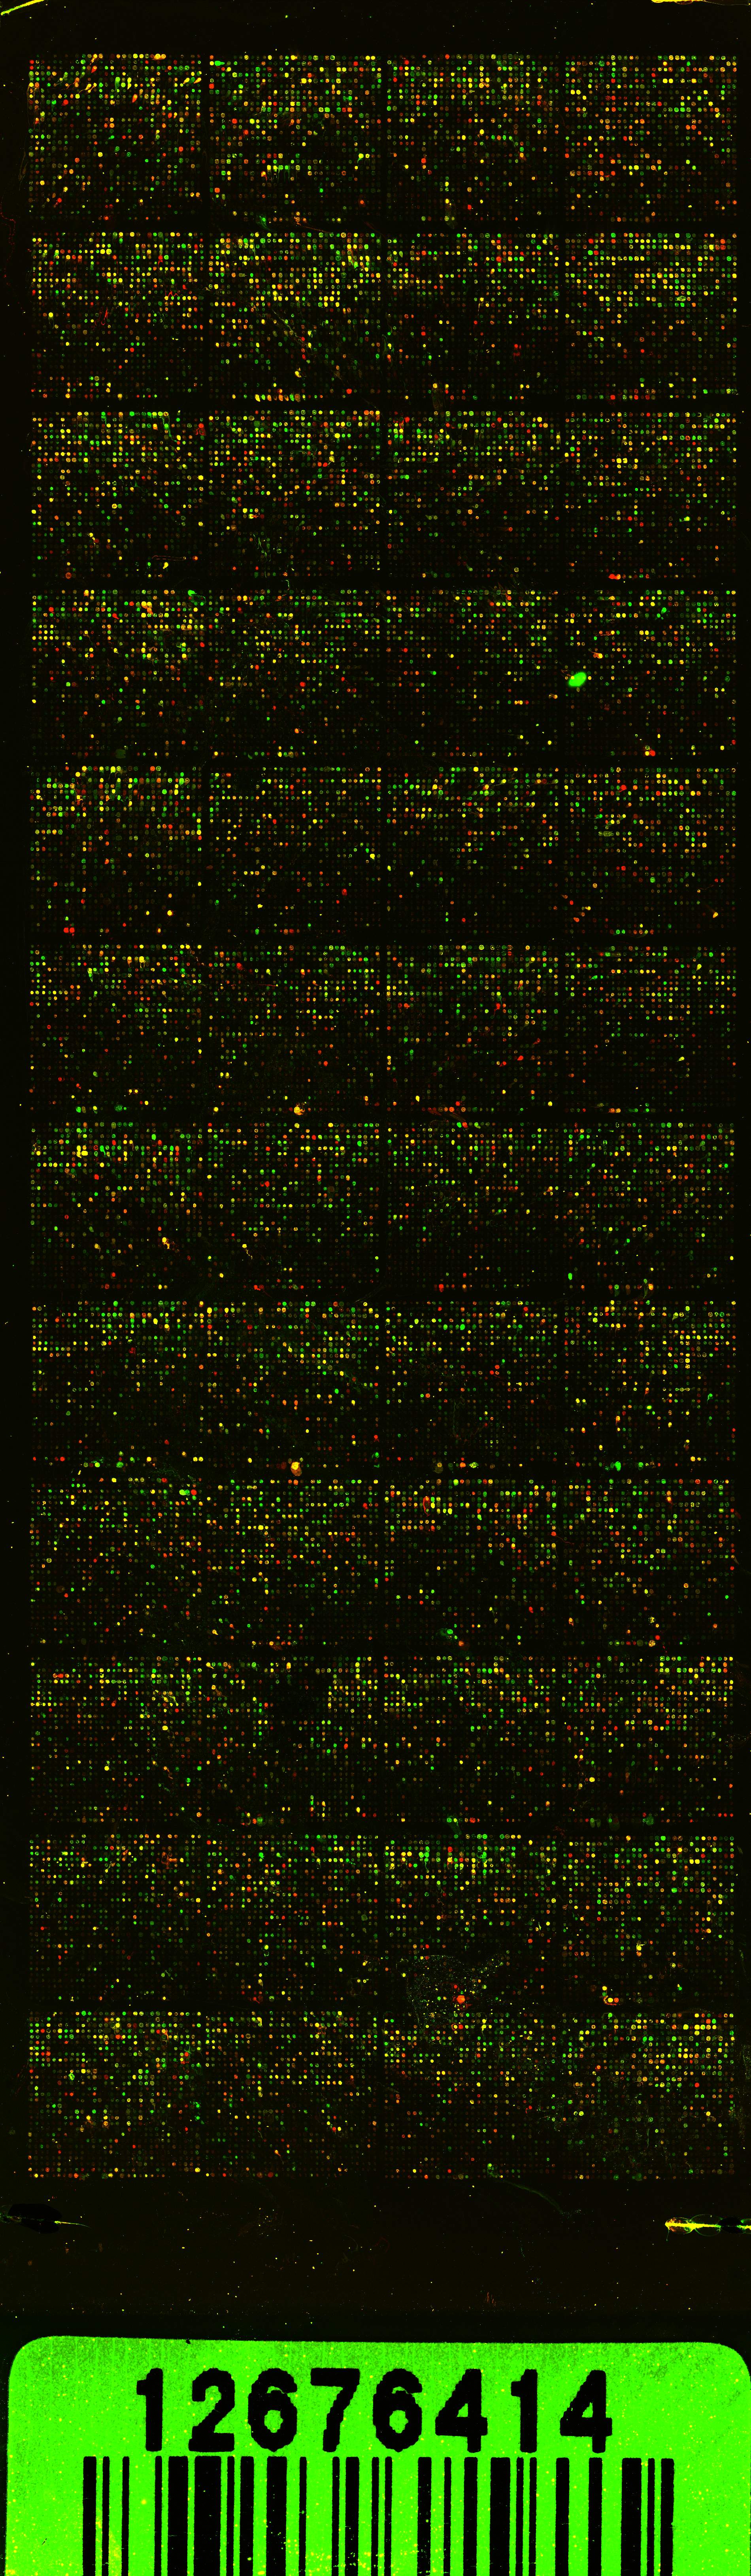
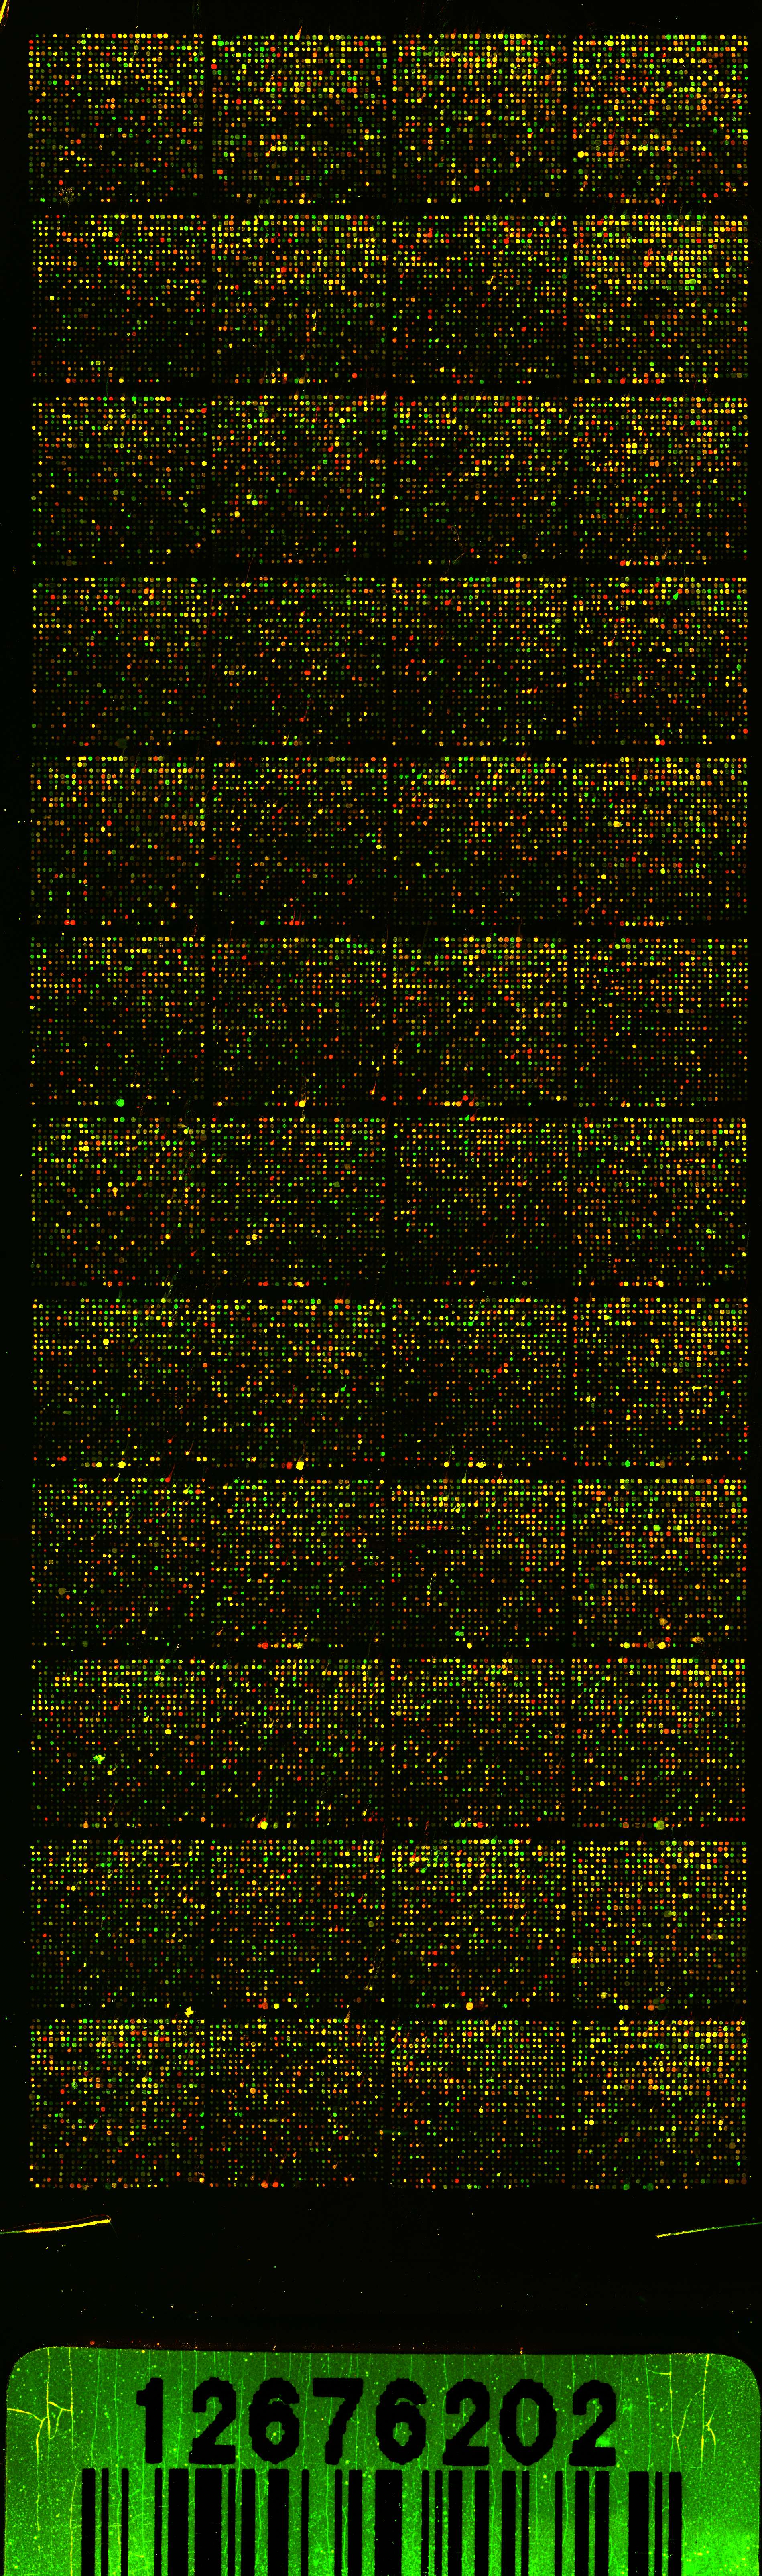
Original data according to MiAME Guidelines
View PDFData of all arrays in a single rar-File: Arraydata.rar