The assessment of task-specific changes in glucose metabolism previously required repeated scans and radioligand applications, with drawbacks of increased radiation burden and variance due to intra-individual differences in task performance, motivation and habituation.
Functional PET (fPET) imaging refers to a novel method to study dynamic changes within a single scanning session. The constant infusion protocol provides free radiotracer throughout the scan, which is then available to bind according to the actual demand as induced by the experimental task. The term fPET furthermore underlines the similarity to fMRI with respect to repeated task performance in a block design and the analysis with the general linear model to separate task effects from baseline radiotracer uptake.
With recent advancements the approach now enables investigation of:
Glucose metabolism with [18F]FDG
Neurotransmitter action of dopamine and serotonin with 6-[18F]FDOPA and [11C]AMT, respectively
Molecular connectivity using high-temporal resolution data in the range of 1–3 seconds
This is complemented by the fPET toolbox, which supports analyses of data obtained with different stimulations, species, radiotracers and scanner types.
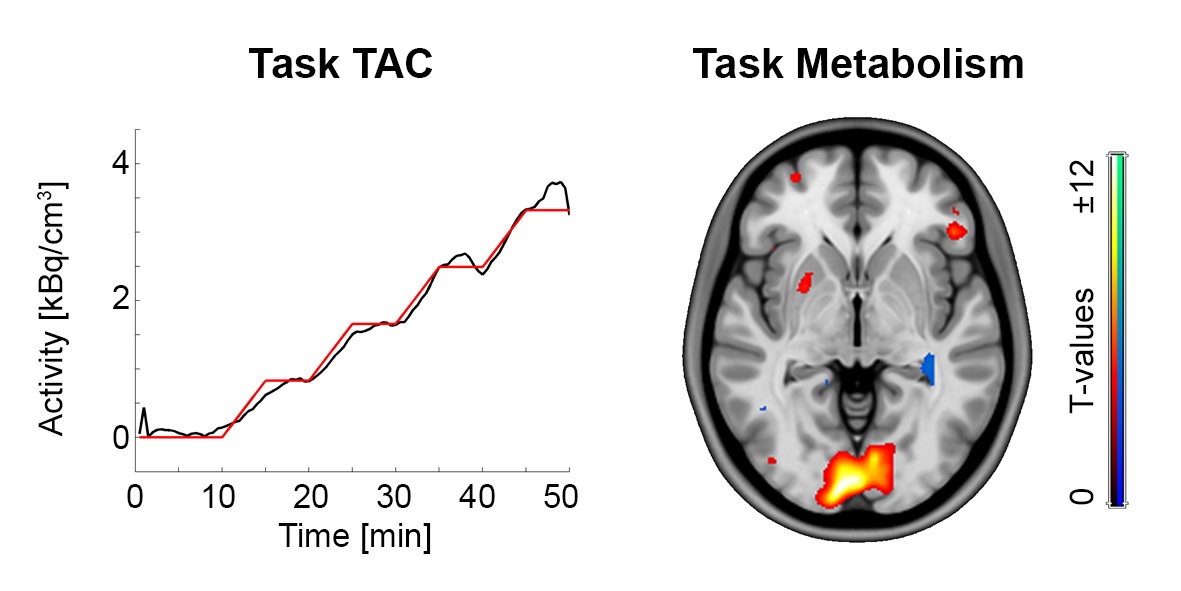
The task specific time activity during visual stimulation shows an increase in [18F]FDG Uptake during the task. Subsequent quantification of the cerebral metabolic rate of glucose and statistical analysis yields a significant increase in the primary visual cortex. [Image adapted from Rischka et al., NeuroImage 181: 323, 2018, post-print]
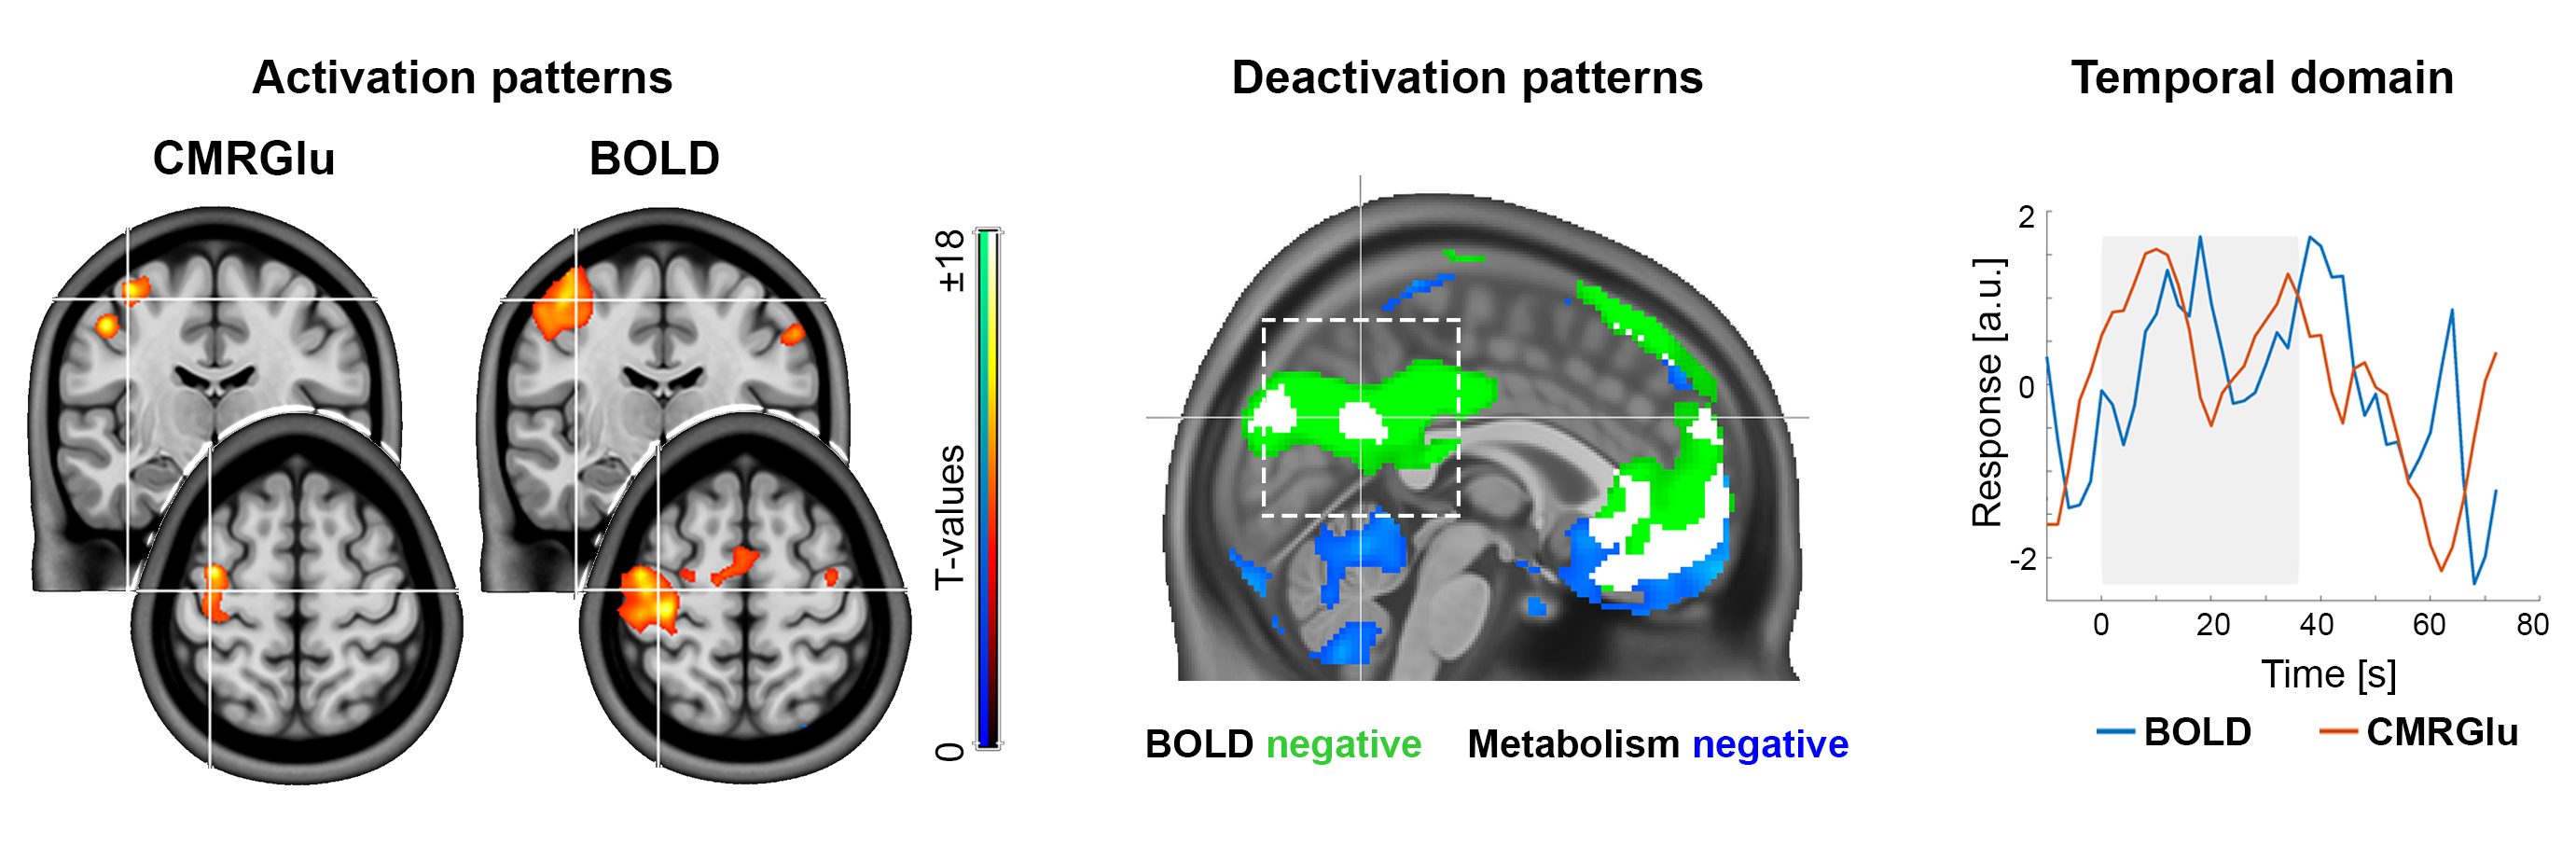
Together with hybrid PET/MR imaging systems, this technique offers new possibilities to study multiple domains of human brain function during task performance. As an examples, this includes comparison of activation patterns in the spatial and temporal domain.
Direct comparison between [18F]FDG fPET and BOLD fMRI shows strong spatial overlap of task-specific neuronal activation (left). Deactivations of both imaging modalities depend on the cognitive task and the correspondingly activated network (middle). The temporal domain reveals high agreement between brain signals at the individual subject level (right). [Image from Rischka et al., NeuroImage 181: 323, 2018Godbersen et al., eLife 12:e84683 (2023);Hahn et al., EJNMMI 51: 1310, (2024); all post-print]