
Science│Art
Exploring the Interface(s) of Science and Art
Our research is the offspring of hard work, perseverance and dedication. It motivates, inspires and fascinates us. So let us recognize and capture these moments. Illustrations, visualization and even unsuccessful experiments can possess a beauty that makes one stop for a moment and smile.
A simple artistic piece can also provide a fantastic tool to communicate science across different fields as well as to the public, and makes it easier to raise awareness, stimulate ideas and foster innovation.
Initiated in 2015 by the YSA in cooperation with the "Creative and Critical Journal Club" and later refined with support from Isabella Ellinger and Klaus Spiess, young scientists are invited to participate in a competitive exhibition on the occasion of the YSA PhD Symposium.
Science│Art Contest
The Science Art exhibition will take place a week before our symposium on the YSA Instagram page and at the symposium's art gallery. The winner will be announced on the last day of the symposium (science party).
The people's choice winner will receive a price of €250,-.
For submission, please visit the "Awards to win" section.
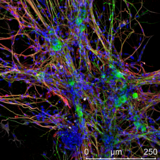
Exhibit 1: It's a team effort
Flavia Millesi
Conceptual description:
Dorsal root ganglia neurons were stained for neuron marker TUIJ1 (in green) and Schwann cells were stained for Schwann cell marker S100 (in red). Structural filament protein Vimentin (in grey) stains all cells (and therefore also shows fibroblasts) and DAPI (in blue) stains all cell nuclei.
Methodology:
The image was obtained using a Leica confocal microscope (SPX8). Immunofluorescence stainings and confocal microscopy allow detailed visualisations of cell cultures and allow identification of cells via cell-type specific markers.
Personal perspective:
I think the picture nicely represents what kind of cellular interplay our body really is. Especially in the nervous system, neurons could never fulfil their tasks without the support of Schwann cells and fibroblasts. We should learn from this and try to collaborate more often. Especially in research, we tend to focus our own careers a bit too much, but together we could achieve so much more than alone.
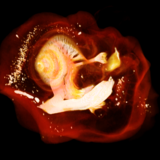
Exhibit 2: Mystery of the Cochlea
Erdem Yildiz
Conceptual description:
We established the surgical cochlear implantation in a large animal model, which represents
similar inner ear dimensions as in humans. Prior to the insertion of contemporary
cochlear implants, which are commonly used in patients, the micro-anatomy of the inner ear
was studied carefully.
Methodology:
A micro-CT scan of a OsO4-fixated minipig cochlea was performed and further analyzed by
volume rendering method with 3D-segmentation software. Red color was set for the
bony parts, and yellow color for the inner cochlear structures, including the modiolus and
the nerve fibers.
Personal perspective:
Since the first time I performed a 3D-segmentation, I’ve been fascinated by the mysterious
compartments and cellular structures of the cochlea. The overlapping picture of the volume
rendering segmentation presents a magical image composition of the cochlear inner and outer
micro-anatomy. The shiny nerve fibers, the mystic stars in the bony part and the red transparentinvisibility cloak represented by the bony capsule inspire me to further understand this organ, and to investigate new approaches to restore hearing function.
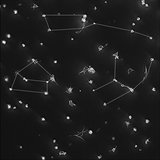
Exhibit 3: Platelets - like stars on a night sky
Anita Pirabe
Conceptual description:
Platelets are small anucleate cells having hemostatic, thrombotic and immunomodulatory
functions. After an vascular injury platelets become activated, secrete intracellular granules and undergo morphological shape changes to seal the leaky vessel. With platelet spreading assays we can study cytoskeleton reorganization and actin rearrangements of healthy and in vitro treated platelets.
Methodology:
Human blood was drawn and platelet rich plasma generated by centrifugation. Platelets were
allowed to attach on fibrinogen coated Ibidi slides for one hour. Platelets were stained with
antibodies against the fibrinogen receptor and actin filaments of the platelet cytoskeleton.
Finally, platelet activation and cytoskeleton reorganization were investigated by high resolution microscopy.
Personal perspective:
Platelets are often underrated in the scientific field. In my opinion, platelets are unique cells with many important functions and it is quite impressive to follow the shape changes that platelets undergo during activation. It always reminds me on a pencil drawing artistic work of a
starlit sky.
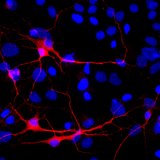
Exhibit 4: Meeting by synapsis
Anette Vaglio-Garro
Conceptual description:
Cells were isolated from cerebral cortex of rats, they were cultured in vitro and fixated. The co-culture contains different populations of brain cells, and in this case, the MAP2 marker was used to identify the neurons from the entire culture. In this figure it is possible to observe the interaction between two neurons that are part of the neurological network.
Methodology:
Cells were labeled with MAP2 to identify neuronal microtubules in a co-culture, nuclei were stained with Dapi. Fluorescence immunostaining is a technique that is often used to mark cells and structures, to allow us to identify and localize specific cell structures, cell types and cell numbers, the images are visualized by fluorescence microscope or confocal.
Personal perspective:
Due to the curiosity of the human being and our desire to know the relationship between astrocytes: neurons in the cerebral cortex, this work of art was born. These two neurons represent very well the phrase “sisters by chance friends by choice”, they are located together in the neural network with thousands of cells and by choice they selected each other to interact together. Both survived the entire immunostaining protocol, and I was able to capture them as they interacted.
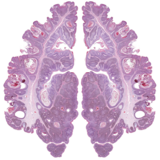
Exhibit 5: The wisdom (w)art monster
Nina Zila
Conceptual description:
Verruca seborrhoica is one of the most common benign growths on the skin and appears in many different shapes, sizes and shades of brown, mostly in middle to old age. That is why it is un-charmingly called 'old-age wart' in German and more elegantly 'wisdom wart' in English. The exophytic growing intra-epidermal proliferations are often superficially ablated, the basaloid (bluish-purple) cells with variable pigmentation and the typically interspersed pink horn inclusions, lead after workup to such characteristic and – at least for pathologists – extremely aesthetic pictures (often very much in contradiction to the patients’ sensation).
Methodology:
The dermatological specimen was formalin-fixed and paraffin-embedded (FFPE) before 4 µm sections were cut and mounted on glass slides before staining with eosin and hematoxylin (H&E). Through brightfield microscopy images of for example these aesthetically pleasing leaf-like structures can be obtained. These techniques are part of the routine methods and procedures performed in a dermatopathology laboratory to gain insight into various pathologies of the skin and provide a high quality diagnosis for patients.
Personal perspective:
In my opinion, the value of this piece does not necessarily lie in a fancy method or lurid image, but stands for the fact that fascinating things can be waiting for you even in the smallest and most unspectacular corners. I discovered the contents of this image during a routine examination and was surprised to find such appealing structures. These leaf-like patterns immediately fascinated me. So I took a part of the histological image and compiled it into this picture. A reflection of my daily work, which not only ensures a successful diagnosis, but also creates small works of art. Like this artistic and harmless wart monster that accompanies many of us unconsciously and whose beauty remains hidden from us.
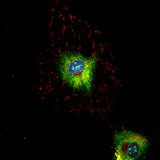
Exhibit 6: Roses are red, eye I'm stressed as hell, the mitochondria is the powerhouse of the cell
Laura Brunnthaler
Conceptual description:
Human liver sinusoidal cells were isolated from hepatic resection livers. Cells were stimulated with our treatment regimen and TNF-α following immunofluorescence staining with antibodies for stress responses.
Methodology:
Immunofluorescence staining of liver sinusoidal cells. Blue is DAPI, yellow is reactive oxygen stress, green is mitochondrial stress, and red is a mitochondrial tracker. Acquisition was done via confocal microscopy at 100x with a Nikon A1 Microscope.
Personal perspective:
In my opinion, my art piece represents the eye of the universe. The blue is the pupil, which lets us glance into a person’s soul. The yellow and green together represent the iris, the colorful part of the eye, which controls how much light enters the eye. The red from the mitochondrial tracker, indicates veins which are more visible, if a person is under high stress and experienced too little sleep. The eyes show the strength and the power of our soul, as the mitochondria is the powerhouse of a cell.
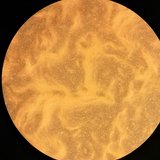
Exhibit 7: From a transwell to the whole universe - cells evolving into a planet
Hilal Demir
Conceptual description:
The presented image illustrates a cell monolayer of human primary nasal epithelial cells (HNECS) growing on transwell inserts for 2 weeks of Air-Liquid (ALI) culture. During ALI culture the cells differentiate into specific cell types of the nasal epithelium. An example being the goblet cells which are responsible for the mucus production. In this case, after 2 weeks of ALI culture the mucus is visibly covering the cells and can be seen here as cloudy compartments.
Methodology:
Growing of primary cells as well as cell lines on transwell inserts is a common technique to mimic physiological properties in vitro and investigate transepithelial permeability and transport. Therefore, cells are grown on semipermeable membranes in liquid-liquid culture and then in Air-Liquid (ALI) culture. Afterwards the cell monolayer is differentiated and ready to be tested with a stimulus (allergens, interleukins, bacteria etc.).
Personal perspective:
In general, it can be a real struggle to grow a cell monolayer on transwell inserts and all wells look kind of different even from the same donor or cell line. This well caught my eye because of the vast amount of mucus covering the cells. I was not able to see the cell layer clearly anymore. To me personally it looks like a moon or even a planet and the fact that it is cells covered by mucus makes it a unique depiction.
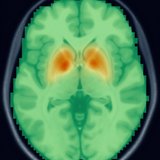
Exhibit 8: Dopamine Eyes
Carina Bum
Conceptual description:
At the core of the neurobiology of schizophrenia is the alteration of dopaminergic signal transmission, in the sense of increased reactivity of the dopamine system. With the agonistic dopamine D2/3 receptor radioligand [11C]-(+)-PHNO, which can be used to assess dopamine release and dopamine synthesis, these changes can be visualized and studied. Since 2012 [11C]-(+)-PHNO and positron emission tomography (PET) are applied to investigate the dopamine system in the brain in healthy subjects and in the context of psychosis. Sometimes, the basal ganglia in the human brain seem to appear like two eyes with a piercing look as can be seen on this PET image.
Methodology:
This image shows the mean [11C]-(+)-PHNO binding potential values of 5 healthy volunteers summarized and thus represents their dopamine D2/3 receptor density.
The images were analyzed using an anatomically unbiased voxel-wise analysis method using specialized software and processing pipelines. Binding potential values in pre-defined regions of interest (ROIs) were obtained using the SRTM and ROMI software. The red and yellow areas indicate high dopamine receptor density.
Personal perspective:
For me personally, this picture, which also appears artistically valuable, represents both the hard work that one has to do as a scientist in order to achieve such results, as well as a possibility to visualize abstractly imposing illnesses such as schizophrenia, which for decades could not be associated with an organic correlate, and thus to underline its significance as a metabolic disease of the brain.
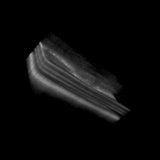
Exhibit 9: Seeing the future in low resolution
Milana Kendrisic
Conceptual description:
What you see is a volumetric image of an artificial human retina – or what we call a “test eye”. The ophthalmologists look at retinal layers, similar to the ones shown in this picture, in order to diagnose different eye diseases. By regularly looking at these layers, the doctors can monitor and therefore either prevent or slow down the spreading of certain diseases.
Methodology:
The technique in use is called “Optical coherence tomography” or OCT. It is a non-invasive imaging technology used to obtain cross-sectional images. OCT is most commonly used in ophthalmology, but can also be a useful asset in dentistry, endoscopy, cardiac imaging, dermatology…
Personal perspective:
“Art imitates life” - Look at this picture, it is noisy, it is in low resolution, it is messy: just like the diseases we are trying to diagnose. And as much as we all enjoy seeing sci-fi like medical robots and medical data shown in 4k, let’s not forget that it is the low-cost devices and low-resolution images that can save the most lives and create the biggest impact on global health.
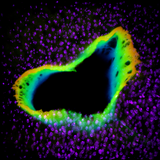
Exhibit 10: Beauty of blood vessels
Sergejs Zavadskis
Conceptual description:
This artwork depicts a 3D render of a blood vessel in precisely cut living liver slices.
The liver was extracted from a Sprague-Dawley rat and slices of 250 µm thickness were
prepared with a microtome (VF-300, Precisionary Instruments Inc.).
The aim of this project is to study vasotropic effects of different branches of unfolded protein
response (UPR). By using confocal microscopy (LSM510, Zeiss) we evaluate the vascular
dilation or contraction induced by various UPR pathways modulator drugs.
Methodology:
Laser scanning confocal microscopy of living tissue stained with fluorescent probes was used to acquire the image. Since endothelial cells highly express eNOS, the vessel was imaged with NO sensitive probe DAF-FM and the nuclei of surrounding tissue were stained with NucSpot. Optical sectioning was implemented to create a stack of images to construct a 3D model of a vessel. These techniques can be used to examine cells or tissue marked with specific metabolite or antibody probes.
Personal perspective:
Nature holds the title of the greatest artist above everybody else, and the pieces of art created by the humankind are either inspired or are a direct reconstruction of its surroundings. Yet,
historically, we were mostly limited to the things only our very own eyes can see. Modern
technology had lifted these boundaries and now it is possible to take a much closer look at the
things we could not witness before and most importantly – observe how beautiful they are.
This image holds a special personal and scientific value as it was one of the of the first images
in the series, which we hope will confirm our theory that UPR has a vasotropic effect.
Exhibit 11: The Tree of Life Cell
Christiano Ramos
Conceptual description:
This picture was done after a dissociation of tumor tissue from a patient with peritoneal
metastatic colorectal cancer, where the isolated cells were cultured to perform tumor and
fibroblast cell cultures. After the removal of fibroblasts, the remaining cells, mainly tumor cells,
were kept in culture. The Tree of Life cell was one of the isolated ones.
Methodology:
Bright field microscopy image.
Personal perspective:
Besides the beauty of the picture, resembling a tree, there is an interesting observation, which is the “behavior” of that cell. After being surgical removed from a mCRC penitent, all the
mechanical and chemical stresses during the tissue dissociation, and the removal of fibroblasts,that cell was still fight to survive. The roots can represent that. I see “Tree of Life Cell” as a representation of that we must not stop “fighting” for that is import for us and never give up.
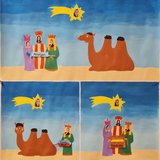
Exhibit 12: Journey of the Magi to Mister Nanobody
Christina Weichwald
Conceptual description:
Three wise women, guided by a star, search for Mister Nanobody. Mister Nanobody represents
the group of camelids producing heavy-chain antibodies. The three magi are bearing allergens
for immunization of the camel. After some bright days and dark nights the magi collect the
camel blood containing allergen-specific heavy-chain antibodies, from which nanobodies
are engineered. With precious nanobodies in their luggage, the magi head back home, where the science of nanobodies begins.
Methodology:
I used acrylic colors to illustrate our concept.
Personal perspective:
“A picture is worth one thousand words” – Art is a fantastic tool to visualize complex methodologies and concepts in an easy and understandable manner. This piece was created to communicate our nanobody project at “Die Lange Nacht der Forschung” (2022) to the public with the aim to bridge the gap between theory and practice.
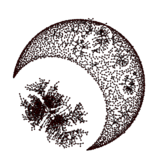
Exhibit 13: Individual-specific dynamics of the T-cell repertoire
Mariella Gloria Gregorich
Conceptual description:
The human immune repertoire is essentially characterized by its total abundance of B and T lymphocytes. The excessive abundance and diversity of these cells grant the remarkable ability of acute and long-term protection of the human body from pathogens. Due to its importance in the antigen-binding process, the CDR3 sequence has been used for a long time as an identifier of the lymphocyte clonality. The structural topology of the T cell receptor (TCR) system of an individual and the similarity of its T cells is capture by graph-theoretical visualization as an individual -specific immune network.
Methodology:
Clonal networks usually consist of nodes representing clones (distinct nucleotide or amino acid sequences) connected by edges if a similarity condition based on the overlap of nucleotide or amino acids is fulfilled. The condition is mostly given by a distance measures such as the pairwise Levenshtein distances between CDR3 sequences. The Levenshtein distance is a string metric for measuring the difference between two sequences by counting the number of edits (insertion, deletion, substitution) required to convert one sequence into the other. This approach leads to mutation networks for B cell receptor repertoires and similarity networks for TCR repertoires. Networks based on the Levenshtein distance for the TCR repertoire thus illustrate CDR3 similarity of unique clonotypes within the observed repertoire sample. The network has been generated by the Kamada-Kawai layout which is a force-directed algorithm for aesthetic graph visualization. The software R was used for data visualization.
Personal perspective:
The computational study of T-cell repertoires is challenging due to the complexity of the high-dimensional receptor sequence landscape. The reduction of complexity is vital in the visualization of immune networks and allows to gain insight into the topology and similarity structure of the immune system of an individual. The minimalist representation manages to display an otherwise complex system that has not yet been fully explored in a compact manner and enables insights to be gained with further graph-theoretical analysis.
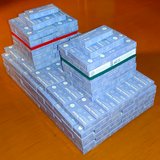
Exhibit 14: Building blocks of succesful treatment
Erik Kornfellner
Conceptual description:
As the home of many diseases and their cures, the AKH towers over Vienna, though it has been badly battered by recent epidemics. No effort should be too great to preserve the health of patients and staff and to fight the disease. What remains are empty boxes, remnants of ingeniously designed technology and a huge logistical effort, reminding us what the hospital is actually made of: terrible diseases and conditions, but also the lifeblood of the employees who give everything for our health.
Methodology:
Polymerase Chain Reaction is a method which requires three simple steps: (I) denaturation of template into single strands, (II) annealing of so called primers to each of the single strands as a guide for new strand synthesis, and (III) extension of the DNA from the primers onwards, which are repeated multiple times. The picture was taken with the most used and handy tool,
the mobile phone camera. Showing us, how we utilize equipment for the daily life, and for scientific progress as well.
Personal perspective:
During these trying times, PCR-tests gained popularity as the first wall of defense against the latest malady. Every test kit, incorporated in this installation, came a long way from china to our hospital, was used and left behind some thrash, while the sample continued its way. The great consumption let us know what kind of effort is made, what is left here and the cost of all this.
In a joint effort, more than two hundred boxes were installed an d now bear visible witness to the effort that goes into making something bigger out ofsmall pieces. Just as many small actions can contribute to the recovery of a whole person.
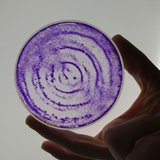
Exhibit 15: The spontaneous beauty of science
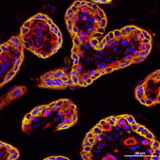
Exhibit 16: The origin of love - materno-fetal interface (placenta)
Rumsha Khan
Conceptual description:
The exchange of molecules between the maternal and fetal circulation requires their transfer across the placental barrier, which consists of the syncytiotrophoblast (cells stained in yellow) and the fetal endothelial cells of the placenta (cells stained in red).
Methodology:
The proteins shown were stained with multiplex immunofluorescence stains in sections of placental tissues and imaged with an automated wide-field fluorescence microscope (TissueFAXS, Tissue Gnostics GmbH).
Personal perspective:
Within the placenta, more precisely in the placental villi, fetal and maternal circulation meet, separated by the cell layers of the placental barrier (syncytiotrophoblast and fetal endothelial cells). The cells of the placental barrier transport nutrients to the baby and at the same time protect the baby from many harmful substances. For me, the villous structure visible here, which happens to be heart-shaped, symbolizes maternal love, which also aims to protect and strengthen us.
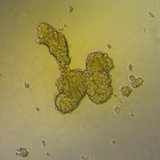
Exhibit 17: Cell poodle
Petra Vician
Conceptual description:
Within a small side project, we performed a viability assay where cells were treated with red
wine (inspired by old lady from Burgenland). The cells on this picture were treated with a 0.1% concentration of wine for 72h.
Methodology:
To acquire the image brightfield microscopy (10x) was used, a simple technique to depict living and dead cells with only a few adjustments. Personal perspective: Wine changes human as well as cellular behavior. Depending on your own wine consumption, you can see a poodle, monkey or squirrel.
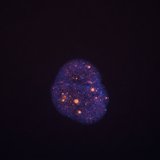
Exhibit 18: Space nucleus
Anna Lämmerer
Conceptual description:
This image shows the nucleus of a pediatric high-grade glioma primary cell model stained
for telomeres. The glioma model has an ATRX and H3.3G34R mutation, which is thought to
provoke alternative lengthening of telomeres (characterized by heterogenous telomere lengths). As can be seen on the image, we confirmed alternative lengthening of telomeres in this model, indicated by large and bright telomere signals as well as very small telomeres.
Methodology:
Slides with metaphase chromosomes and interphase nuclei were prepared using colchicine.
Telomeres were visualized by using telomere-specific fluorescence in situ hybridization
(Telo-FISH), detecting telomeres in interphase nuclei. Cell nuclei were stained with DAPI. Images were taken on a Leica DM RXA microscope.
Personal perspective:
From the very first look at this image it remembered me of the famous space pictures of earth.
Similar like an astronaut might discover new things about earth by looking at it from a far
distance, a scientist, simply using a microscope and no space shuttle, explores unknown
territories, discovers new characteristics of organisms and tries to defeat the aliens (in my case
cancer cells).
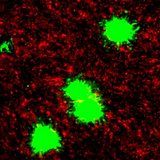
Exhibit 19: Sphere lasertag
Carola Jaunecker
Conceptual description:
Glioma are known for their highly invasive character. Therefore, glioma spheres labeled with
GFP where seeded on blood endothelial cells labeled in red. After some hours the glioma spheres made holes in the blood endothelial cells, resembling the invasive character.
Methodology:
The pictures were taken in live cell microscopy, which is often used to look on the behavior of
living cells over a longer time period.
Personal perspective:
Glioma spherees are capable of making holes into blood endothelial cells, thereby invading into blood vessels. That reminded me of lasertag game where you get shot down by colorful little balls, which can hurt you very much and also cause servere damage on your skin. So you better not get hit by a lasertag ball- or a glioma sphere
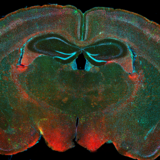
Exhibit 20: Trapped cells in the brain
Laura Cuenca Rico
Conceptual description:
This piece represents a coronal section of an adult female TRAP mouse brain.
The TRAP mouse model let us detect cells activated when a stimulus is induced. Our stimulus is an artificial virus infection, after its induction the cells that are activated will express a fluorescent gene, td-Tomato, shown in the image in red. Through immunostaining techniques, we can additionally detect cells activated after specific behaviors, like the pup retrieval test, labeled in this image in green. The blue color represents the nucleus of the cells. Therefore, within the same animal we can detect activation of cells in different time points and behaviors
Methodology:
Immunostaining technique and fluorescent microscopy.
Personal perspective:
This image represents the beauty of the brain. Combines science and its techniques, such as animal models, immunohistochemistry and microscopy to the magnificence of art.
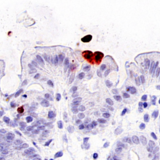
Exhibit 21: Love in the gut
Bernadette Mödl
Conceptual description:
The intestinal epithelium is renewing itself constantly by the proliferation of stem cells in the
crypts and subsequent differentiation. The “old” epithelial cells are dying after a few days and
shed into the lumen of the gut.
Methodology:
Sections of the mouse colon were stained by immunohistochemistry with a cleaved Caspase 3
antibody to visualize dying cells (supported by Anne Ebner, Daniela Zwolanek, Gerald Timelthaler).
Personal perspective:
On the picture you can see two cells that are positive for cleaved Caspase 3, so they are about to be shed into the gut lumen. These two cells love each other so much, that they are dying together by forming a heart.
Exhibit 22: Drugs on Network
Michail Evgeniou
Conceptual description:
Drugs Targets interactions from patients on peritoneal dialysis.
Methodology:
The images have been created on R scripting language. And been sized manipulated
With cystoscope.. After collect, clean and analyze the raw data files.
Personal perspective:
Not only the title it's fun. Furthermore the fact that the whole picture can be reproduced in every person's computer just by using R opens a huge topic for conversation that connects modern society to he very fundamental ideas of what is art.
Exhibit 23: Water and Dust on Blood
Sophie Edtmayer
Conceptual description:
The image depicts H&E-stained blood smears of leukemia bearing mice. This staining is frequently used for the diagnosis of hematopoietic malignancies as it helps to identify different cell types including leukemic blasts. Unfortunately, the blood smears were not only H&E stained but were also covered in dust and damaged with water splashes due to an unplanned construction work while the samples were drying on the bench.
Methodology:
H&E-stained blood smears from leukemia bearing mice imaged with a microscope (40x magnification).
Personal perspective:
Although it was frustrating finding samples that were collected over weeks in this poor condition, I still went through every sample desperately looking for areas that were not affected. I did not only find nice representative areas but also very artistically altered patterns. I hereby learned a very important lesson that is still accompanying me now in my PhD studies. Sometimes you cannot avoid failures, but you can make the best of it.
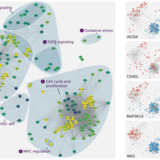
Exhibit 24: Gene regulation as a common language to link rare immunodeficiencies
Fangwen Zhao
Conceptual description:
Monogenic diseases provide useful definitions for diagnosing rare immunodeficiencies, linking a checklist of clinical “phenotypes” to a causative “genotype”. However, such gene-centric approaches present a fragmented view on molecular contributors in our immune system, without a common modality to systematically compare diseases. Here, the epigenome provides a bridge between genotype to phenotype by capturing both disease-specific and common regulatory changes across diverse immunodeficiencies.
Methodology:
We constructed a pan-disease gene regulatory network based on enriched transcription factor motifs in differentially accessible chromatin regions. Gene regulatory networks can identify the broader context of changes to transcription. While typical approaches are typically applied on an individual basis, our network integrates the chromatin regulatory signatures of 24 distinct diseases, enabling us to systematically contrast specific and common changes across diverse immunodeficiencies.
Personal perspective:
Being able to connect the isolated tidbits of meticulously collected knowledge is becoming increasingly important in our information-rich world. This is very much exemplified in the “gene-hunting” field, where novel monogenic diseases have provided immense insight into our understanding of the human immune system at the molecular scale, but have yet to reflect the systems-level effect on cellular state and phenotype linked to disease. For this, a common modality for comparison is required – the language of epigenomic gene regulation serves this purpose. This piece illustrates the complexity of these “global” regulatory effects – and that even macroscopically distinct diseases can share common regulatory themes.
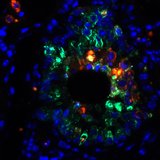
Exhibit 25: The black hole
Alina Fokina
Conceptual description:
Imunofluorescence staining of SARS-CoV-2 infected mouse lung (with a mouse-adapted virus) on second day post infection. Red stain represents viral nucleocapsid, green stain represents club cells in the bronchiole of the lung, blue stain represents cell nuclei. The concept of this triple stain was to see, which structural cells can be infected with SARS-CoV-2.
Methodology:
For staining embedded samples were deparaffinised by and rehydrated. The slides were than incubated overnight with SARS Nucleocapsid Antibody and then with donkey anti-rabbit IgG AF555. For second stain, slides were incubated overnight with anti-Uteroglobin Antibody, followed by incubation with donkey anti-goat IgG AF488. At the end slides were treated with Prolong Gold Antifade with DAPI. Pictures were made with an AxioImager microscope. Visualising cellular interactions and sctructure.
Personal perspective:
„If you gaze long enough into an abyss, the abyss will gaze back into you”
- Friedrich Nietzsche
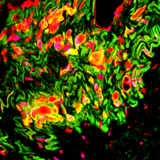
Exhibit 26: Descending from myo-molecular reality into the beyond
Michaela Martina Zrelski
Conceptual description:
Skeletal muscles are elaborately organized machines designated for contraction that are comprised of a plethora of structural proteins to build the force-generating apparatus. A disruption in this interplay leads to disease, the death of muscle fibers, and finally the occurrence increased connective and fatty tissue replacing the myofibers. This picture shows the results of muscle degeneration that ultimately leads to a loss of muscle function and
progressive weakness.
Methodology:
Here a model example for a diseased muscle tissue was cut into ultrathin sections and subjected to immunofluorescence staining targeting two muscle-specific and a general membrane marker protein. Nuclei were visualized with DAPI. The picture was generated by utilizing confocal microscopy. This is a standard technique to analyze the expression and localization of proteins within cells or tissues.
Personal perspective:
-
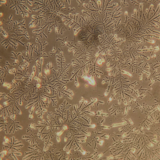
Exhibit 27: Let it snow - let it grow!
Oliver Baumfried
Conceptual description:
Colon cancer cell lines were cultured in order to investigate sensitivity towards different
therapeutics. Pictures were taken regularly for control of normal cellular behavior in cell culture.
Methodology:
Image was acquired via light microscopy, 20x magnification at routine cell culture control.
Personal perspective:
When even climate change exerts an influence on the behaviour of cancer cells – let it snow!
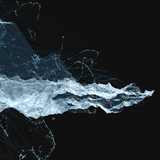
Exhibit 28: On the Shape of Digital Matter
Christiane Hütter
Conceptual description:
The human organism is composed of more than 20000 proteins connected through over
300 000 links to create and maintain a living system. The complexity of high-dimensional information of such system is hard to grasp in our understanding of space. The artwork captures a possible shape of protein-protein interactions within a 3d virtual reality. It
offers a way to intuitively explore biological functionality or disease topographies through
exploratory visual data analysis.
Methodology:
Typical network representations are often limited to two dimensions, without the possibility to interactively explore the high information content shown.
One of the key concepts used to produce the depicted three-dimensional biological
network visualization is the application of dimensionality reduction on predefined
feature spaces. Through technological advances in design-related fields, such as 3d rendering and virtual reality, one can explore the high-dimensional datawith tools that
go beyond conventional, static methods.
Personal perspective:
The art work presented here should emphasize the value of cross-disciplinary approaches
in regard to the future of digital data representation and exploratory analysis methods. It was part of a recently published work (Cover of the February issue of nature computational science / publication: Huetter et al., 2022), a joint endeavor of scientists
and artists working together on mapping the shape of biological networks, redefining the too
ls for data exploration and analysis beyond established methods.
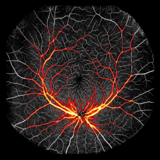
Exhibit 29: I See Fire
Julius Scherer
Conceptual description:
From driving cars to detecting diseases, more and more vital tasks can be automated with artificial neural networks. However, by design these networks act as a black box and have to be blindly trusted. Therefore, this research project focuses not only on an autonomic detection of diabetic retinopathy, but also on illustrating the reasons behind the neural networks' prediction.
Methodology:
The image depicts the vascular network in the human retina, acquired by optical coherence tomography angiography. On top, the most important features the network learned in order to classify diabetic structures were overlaid. These features were acquired with Grad-Cam, a technique that calculates feature importance in the context of overall class prediction.
Personal perspective:
Neural network interpretability is important. It is needed to find areas of weakness in our algorithms. It is also needed to avoid bias or even discrimination by our AI. In this image, we can see that the network is classifying for diabetic retinopathy by only focusing on large blood vessels. While this will work in some cases, other cases will inherently fail, as those can only be classified on the basis of very fine vessel structures.
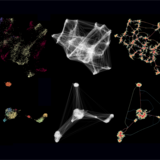
Exhibit 30: Networks Explain the Multiverse of Data
Stephan Reichl
Conceptual description:
Immune checkpoint inhibitors provided a novel therapeutic option for cancer patients, but some develop resistance. scRNA-seq analysis of patient biopsies identified macrophages expressing immune checkpoints. We hypothesize that the observed resistance to therapy is partially mediated by this population. To test this and identify novel targets involved in immune checkpoint regulation, we performed a pooled CRISPR screening approach with single cell RNA-seq as phenotypic read out (CROP-seq).
Methodology:
We performed UMAP (Uniform Manifold Approximation and Projection), a dimensionality reduction method used in scRNA-seq analysis, to investigate our CROP-seq data. The upper row shows RNA profiles colored by the treatment the cells were exposed to. The lower row visualizes perturbation signatures of the same cells colored by their assigned CRISPR knockout. The first column shows each cell as a dot, the second the edges of the underlying graph and the third bundles and colors the edges by density.
Personal perspective:
Artistic value: Art has always found ways to express intangible concepts. Here, we show results of a complex experiment in a visually appealing and comprehensive way. Using beautiful visualizations is a great way to pique interest as the first step to get people more involved in science or students to consider a career in science.
Personal value: Exact visualization of high-dimensional data in two dimensions is most of the time impossible. Nevertheless, it is of the utmost importance to ensure that the low-dimensional visualizations are not driven by artifacts or neglect an important aspect of the data. Here, the first plots in both rows visualize different aspects of the same dataset underscored by the different coloring by treatment and CRISPR knockout, respectively. The two following columns visualize the graphs at the heart of the UMAP method to ensure reliable representation in low dimensions.
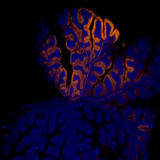
Exhibit 31: Cerebellar Landscape at Sunset
Michael Winklehner
Conceptual description:
During the severe disease course of paraneoplastic cerebellar degeneration (PCD), autoimmune processes lead to a widespread loss of neurons, specifically Purkinje cells (PCs) within the cerebellar cortex that physiologically express calbindin. In our study (doi:10.1212/NXI.0000000000200006), we described that PCD subtypes differ in neuropathology and pathophysiology, and may therefore have distinct therapeutical potentials. This piece visualizes the loss of PCs.
Methodology:
With multiplex immunofluorescence several antibodies can be used simultaneously to quantitatively and qualitatively study the expression of proteins, enabling spatial correlation on a single slice of e.g. formalin-fixed and paraffin-embedded brain tissue (here: human cerebellum; orange color: calbindin).
Personal perspective:
This image can on the one hand be interpreted as relation of the title to the underlying pathophysiology of time-dependent neuronal loss, and on the other hand be seen simply as an abstract, colorful art piece, possibly transporting the viewer to a sunset at or under the sea.
Exhibit 32: Rabbit hole
Malgorzata Malys
Conceptual description:
This piece of art grew from a failed western blot, with bubbles that created rabbit shapes.
The picture visualizes the struggles of scientific progress. The scientists dives into the rabbit hole of undiscovered territories, not knowing if they are going to find wonderland or forever get lost in the maze of misleading observations. To disentangle the meandering thoughts inside the rabbithole one needs to carry the lantern of curiosity.
Methodology:
Hand-drawn rabbits were composed on the background of a western blot canvas. The western
blot was acquired with an imaging system. Western blots are usually used to determine protein
expression in a specific condition or cell type.
Personal perspective:
“Rabbit hole” conveys a message of motivation and inspiration, as it shows that even from a
“failure” something beautiful can arise if you take things out of their given context and look at
them from a different perspective.
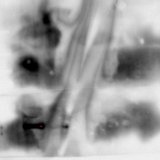
Exhibit 33: You get what you work for, not what you wish for
Stefanie Weiss
Conceptual description:
Everybody knows the tension when you wait to see your Western Blot image. To see if the effort you put in is working out. Unfortunately, the reality is often not that nice, and you do not get the bands you wished for.
Methodology:
Western Blot
Personal perspective:
After many failed trials of this particular Western Blot, I desperately hoped for a nice outcome. Yet the result was suboptimal, and one usually would cry at the sight of such a result. However, I was smiling because I thought of M&Ms. This picture changed my attitude towards unwanted outcomes. Now, I always believe that every lousy side also has a sweet one; you do not get what you wish for, but you can work for it, and someday you will get the desired outcome.
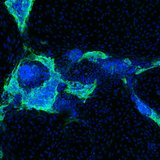
Exhibit 34: Van Gogh's catch
Rozalina Galimullina
Conceptual description:
After many failed trials of this particular Western Blot, I desperately hoped for a nice outcome. Yet the result was suboptimal, and one usually would cry at the sight of such a result. However, I was smiling because I thought of M&Ms. This picture changed my attitude towards unwanted outcomes. Now, I always believe that every lousy side also has a sweet one; you do not get what you wish for, but you can work for it, and someday you will get the desired outcome.
Methodology:
Fluorescent immunostaining for P75 marker (membrane) of the neural crest cells and DAPI (nuclei) is used for characterization of successful differentiation of human induced pluripotent stem cells into the neural crest cells. Cells are visualized by confocal microscopy with Ziess LSM 780 microscope.
Personal perspective:
I called this piece “Van Gogh’s catch” because the colour choice and how cellular nuclei blend into fish forms remind me a lot of the style of Van Gogh’s “The Starry Night”, even though the composition itself and the circumstances in which it was obtained were less romantic. It was made around lunchtime in a dark confocal microscopy room, so maybe at this point I was hungry enough to catch a fish around many thousands of cells. Nevertheless, even if the amount of P75 positive cells were much lower than I would expect, the overall distribution of them was high enough to create this magical piece. At that very moment perceiving the beauty and aesthetic part of the work saved me from hunger, anger and scientific frustration.
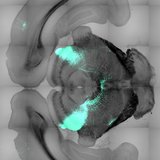
Exhibit 35: Long-range axonal projections from the visual cortex to the superior colliculus
Marta Solano
Conceptual description:
Long-range neuronal projections from the visual cortex to the superior colliculus. To study connectivity of the prefrontal cortex we use retrograde viral approaches which result in the uptake of the virus (expressing in this case GFP) by axon terminals of neurons at the afferent target of the neurons and will be transported to the somata. We were able to visualize not only prefrontal cortex but also projection afferents such as the visual cortex.
Methodology:
The main technique used to acquire the image was confocal microscopy. It is an optical imaging technique that increases resolution and contrast in comparison to other imaging techniques and allows simultaneous scanning and imaging at multiple wavelengths simultaneously
Personal perspective:
The image shows the unequivocal connection between different brain regions and in this case how a mainly involved in saccade movement directly controls visual-motor functions. In my opinion, this image beautifully shows a snippet of what occurs in the brain when you turn your gaze towards this art piece.
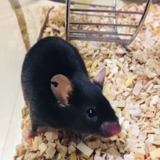
Exhibit 36: Blacky and the Brain
Anna Gundacker
Conceptual description:
Animal models allow the translation from basic research to clinical applications. They enable the development of vaccines and the assessment of possible new treatments and medication. Through them, we are able to gain more insight into developmental processes, possible influences and how we can counteract disruptions. Animal models help researchers to better understand human physiology, development, diseases and treatments.
Methodology:
Video tracing of home cage behavior
Personal perspective:
"Mice spend their whole life supporting scientists in their research. Therefore, we have the
responsibility to treat them in the best possible way and honor their value to science. "
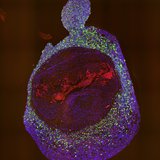
Exhibit 37: Human skin organoid containing melanoma cells (in green)
Madalina-Alexandra Mirea
Conceptual description:
Human skin organoid derived from embryonic stem cells (line WA19) with GFP positive
melanoma cells (line 1205Lu). In red cleaved Caspase-3 positive cells (dying cells). In blue
stained by DAPI the cells nuclei.
Methodology:
Fluorescently labelled tumor cells were transplanted onto skin organoids at day 85. After 16 days in culture, the organoid was fixed, embedded and processed into 4 um sections. These were used for an immunofluorescence staining using DAPI, GFP and cleaved Caspase 3 in order to observe how the melanoma cells have migrated inside the organoid.
Personal perspective:
For me this is an important piece because it shows for the first time that melanoma cells can
integrate themselves inside a skin organoid in vitro and migrate inside the tissue. Note that the
organoid develops inside out, meaning that to the outside we have dermis and inside epidermis. This particular tumor line seems to invade towards the epidermis. In an in vivo situation, the invasion and migration would happen from epidermis towards dermis. The picture was generated around Easter time and back then I compared it with a colourful Easter egg.